The US FDA’s proposed rule on laboratory-developed tests: Impacts on clinical laboratory testing
Contents
| ||||||||||||||||||||||||||
| ||||||||||||||||||||||||||
 County Results
| ||||||||||||||||||||||||||
| Elections in Oklahoma |
|---|
 |
|
|
The 1948 United States presidential election in Oklahoma took place on November 2, 1948. All forty-eight states were part of the 1948 United States presidential election. Voters chose ten electors to the Electoral College, who voted for president and vice president.
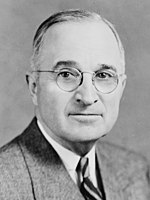
Incumbent Democratic President Harry S. Truman won Oklahoma by a landslide 25.5 percentage points.[1] This made Oklahoma the fourth most Democratic state in the nation, and 21 percent more Democratic than the nation as a whole. This makes it the third best performance (after Franklin D. Roosevelt's 1932 and 1936 landslides) of any Democratic nominee in the state.[2]
Background
Up to this election, Oklahoma was a reliably Democratic state, with the party winning all but two of the first eleven presidential elections in the state. However, like other states in this Solid South, Oklahoma has since become a Republican bastion. In Dwight D. Eisenhower's landslide elections of 1952 and 1956, Adlai Stevenson II lost every antebellum free-soil or postbellum state, however Oklahoma remained more Democratic than the nation as a whole.[2] In 1960, John F. Kennedy lost most postbellum states, including Oklahoma, due to anti-Catholic sentiment.[3] In 1964, Lyndon Johnson became the last Democratic presidential candidate to carry the state,[4] with only Jimmy Carter in 1976 subsequently reaching even 45% of the vote, and no Democrat after 2000 reaching 35% of the vote or even winning a single county in the state.[5]
Results
| 1948 United States presidential election in Oklahoma[1] | |||||
|---|---|---|---|---|---|
| Party | Candidate | Votes | Percentage | Electoral votes | |
| Democratic | Harry S. Truman (incumbent) | 452,782 | 62.75% | 10 | |
| Republican | Thomas E. Dewey | 268,817 | 37.25% | 0 | |
| Totals | 721,599 | 100.0% | 10 | ||
| Voter turnout (Voting age) | 52.5%[6] | ||||
Results by county
| County | Harry S. Truman
Democratic |
Thomas Edmund Dewey
Republican |
Total votes cast[7] | ||
|---|---|---|---|---|---|
| # | % | # | % | ||
| Adair | 3,067 | 56.03% | 2,407 | 43.97% | 5,474 |
| Alfalfa | 1,838 | 39.93% | 2,765 | 60.07% | 4,603 |
| Atoka | 3,104 | 75.03% | 1,033 | 24.97% | 4,137 |
| Beaver | 1,596 | 52.92% | 1,420 | 47.08% | 3,016 |
| Beckham | 4,544 | 77.62% | 1,310 | 22.38% | 5,854 |
| Blaine | 2,595 | 47.79% | 2,835 | 52.21% | 5,430 |
| Bryan | 7,748 | 85.01% | 1,366 | 14.99% | 9,114 |
| Caddo | 8,110 | 68.13% | 3,793 | 31.87% | 11,903 |
| Canadian | 5,568 | 59.89% | 3,729 | 40.11% | 9,297 |
| Carter | 9,474 | 81.52% | 2,147 | 18.48% | 11,621 |
| Cherokee | 4,249 | 60.41% | 2,785 | 39.59% | 7,034 |
| Choctaw | 4,750 | 82.09% | 1,036 | 17.91% | 5,786 |
| Cimarron | 894 | 57.90% | 650 | 42.10% | 1,544 |
| Cleveland | 6,556 | 64.10% | 3,671 | 35.90% | 10,227 |
| Coal | 2,124 | 82.07% | 464 | 17.93% | 2,588 |
| Comanche | 7,955 | 74.06% | 2,787 | 25.94% | 10,742 |
| Cotton | 2,613 | 77.98% | 738 | 22.02% | 3,351 |
| Craig | 4,182 | 59.84% | 2,807 | 40.16% | 6,989 |
| Creek | 9,198 | 58.47% | 6,532 | 41.53% | 15,730 |
| Custer | 4,618 | 64.26% | 2,568 | 35.74% | 7,186 |
| Delaware | 3,157 | 57.40% | 2,343 | 42.60% | 5,500 |
| Dewey | 2,049 | 57.83% | 1,494 | 42.17% | 3,543 |
| Ellis | 1,420 | 48.27% | 1,522 | 51.73% | 2,942 |
| Garfield | 8,217 | 44.25% | 10,352 | 55.75% | 18,569 |
| Garvin | 6,779 | 80.13% | 1,681 | 19.87% | 8,460 |
| Grady | 8,136 | 73.84% | 2,882 | 26.16% | 11,018 |
| Grant | 2,126 | 46.25% | 2,471 | 53.75% | 4,597 |
| Greer | 3,044 | 81.02% | 713 | 18.98% | 3,757 |
| Harmon | 2,340 | 89.79% | 266 | 10.21% | 2,606 |
| Harper | 1,281 | 51.20% | 1,221 | 48.80% | 2,502 |
| Haskell | 3,206 | 69.76% | 1,390 | 30.24% | 4,596 |
| Hughes | 5,492 | 76.62% | 1,676 | 23.38% | 7,168 |
| Jackson | 5,450 | 85.52% | 923 | 14.48% | 6,373 |
| Jefferson | 3,326 | 85.68% | 556 | 14.32% | 3,882 |
| Johnston | 2,936 | 83.41% | 584 | 16.59% | 3,520 |
| Kay | 10,119 | 52.98% | 8,982 | 47.02% | 19,101 |
| Kingfisher | 2,488 | 45.91% | 2,931 | 54.09% | 5,419 |
| Kiowa | 4,263 | 73.59% | 1,530 | 26.41% | 5,793 |
| Latimer | 2,536 | 73.40% | 919 | 26.60% | 3,455 |
| Le Flore | 6,786 | 70.64% | 2,821 | 29.36% | 9,607 |
| Lincoln | 4,913 | 55.76% | 3,898 | 44.24% | 8,811 |
| Logan | 4,109 | 51.84% | 3,817 | 48.16% | 7,926 |
| Love | 2,191 | 89.80% | 249 | 10.20% | 2,440 |
| Major | 1,227 | 33.22% | 2,467 | 66.78% | 3,694 |
| Marshall | 2,455 | 83.96% | 469 | 16.04% | 2,924 |
| Mayes | 4,201 | 59.55% | 2,854 | 40.45% | 7,055 |
| McClain | 3,451 | 79.17% | 908 | 20.83% | 4,359 |
| McCurtain | 6,223 | 85.08% | 1,091 | 14.92% | 7,314 |
| McIntosh | 3,674 | 71.81% | 1,442 | 28.19% | 5,116 |
| Murray | 3,054 | 79.28% | 798 | 20.72% | 3,852 |
| Muskogee | 13,860 | 67.77% | 6,592 | 32.23% | 20,452 |
| Noble | 2,770 | 53.27% | 2,430 | 46.73% | 5,200 |
| Nowata | 2,688 | 55.92% | 2,119 | 44.08% | 4,807 |
| Okfuskee | 3,335 | 67.25% | 1,624 | 32.75% | 4,959 |
| Oklahoma | 59,954 | 59.89% | 40,161 | 40.11% | 100,115 |
| Okmulgee | 10,467 | 70.56% | 4,368 | 29.44% | 14,835 |
| Osage | 7,156 | 64.43% | 3,951 | 35.57% | 11,107 |
| Ottawa | 7,243 | 62.73% | 4,304 | 37.27% | 11,547 |
| Pawnee | 2,721 | 50.65% | 2,651 | 49.35% | 5,372 |
| Payne | 7,390 | 56.03% | 5,799 | 43.97% | 13,189 |
| Pittsburg | 9,576 | 76.80% | 2,893 | 23.20% | 12,469 |
| Pontotoc | 7,750 | 77.20% | 2,289 | 22.80% | 10,039 |
| Pottawatomie | 10,220 | 68.22% | 4,760 | 31.78% | 14,980 |
| Pushmataha | 2,977 | 79.05% | 789 | 20.95% | 3,766 |
| Roger Mills | 2,176 | 81.04% | 509 | 18.96% | 2,685 |
| Rogers | 4,197 | 59.57% | 2,849 | 40.43% | 7,046 |
| Seminole | 8,122 | 70.35% | 3,423 | 29.65% | 11,545 |
| Sequoyah | 4,449 | 68.17% | 2,077 | 31.83% | 6,526 |
| Stephens | 6,702 | 77.83% | 1,909 | 22.17% | 8,611 |
| Texas | 2,693 | 61.64% | 1,676 | 38.36% | 4,369 |
| Tillman | 4,071 | 79.37% | 1,058 | 20.63% | 5,129 |
| Tulsa | 38,548 | 47.33% | 42,892 | 52.67% | 81,440 |
| Wagoner | 3,389 | 55.97% | 2,666 | 44.03% | 6,055 |
| Washington | 5,508 | 47.71% | 6,036 | 52.29% | 11,544 |
| Washita | 4,326 | 72.55% | 1,637 | 27.45% | 5,963 |
| Woods | 2,882 | 50.10% | 2,871 | 49.90% | 5,753 |
| Woodward | 2,180 | 47.69% | 2,391 | 52.31% | 4,571 |
| Totals | 452,782 | 62.75% | 268,817 | 37.25% | 721,599 |
Counties that flipped Republican to Democratic
- Adair
- Beaver
- Cimarron
- Delaware
- Dewey
- Harper
- Kay
- Lincoln
- Logan
- Mayes
- Nowata
- Noble
- Pawnee
- Payne
- Rogers
- Woods
- Wagoner
Analysis
The Progressive Party obtained the necessary 5,000 signatures to appear on the ballot in two days.[8] Gerald L. K. Smith filed a lawsuit in an attempt to remove the party from the ballot. The state election board rejected Wallace's electors stating that the Progressives were not a political party as the Oklahoma Secretary of State had not approved their non-communist affidavit prior to the filing deadline. The secretary of state was not allowed to accept these affidavits until May 2 while the filing deadline was April 30. The Oklahoma Supreme Court ruled five to two against the Progressives in Cooper v. Cartwright. The Progressives appealed to the Supreme Court of the United States, but John Abt dropped the lawsuit due to the "difficulty of getting grounds for a federal suit".[9]
Truman won all but 10 counties in the state; of the 10, only Grant has voted Democratic since. This is the last occasion in which the contiguous counties of Texas, Beaver, Harper and Woods – which now form one of the most conservative regions in the nation – have voted Democratic, as well as the last time that Kay County has.[5] As a result, this is also the last time that a Democrat has swept every county in the Oklahoma Panhandle. This is also the most recent election in which Oklahoma voted for a different candidate than neighboring Kansas.
See also
References
- ^ a b "1948 Presidential General Election Results – Oklahoma". uselectionatlas.org.
- ^ a b Counting the Votes; Oklahoma
- ^ Menendez, Albert J.; The Religious Factor in the 1960 Presidential Election: An Analysis of the Kennedy Victory over Anti-Catholic Prejudice; pp. 79, 117 ISBN 0786460377
- ^ Gust, Steve (October 6, 2012). "Oklahoma student who attended Democratic National Convention anticipates lifetime in politics". The Oklahoman. Retrieved November 9, 2016.
- ^ a b Sullivan, Robert David; ‘How the Red and Blue Map Evolved Over the Past Century’; America Magazine in The National Catholic Review; June 29, 2016
- ^ Gans, Curtis and Mulling, Matthew; Voter Turnout in the United States, 1788-2009, p. 481 ISBN 9781604265958
- ^ Scammon, Richard M. (compiler); America at the Polls: A Handbook of Presidential Election Statistics 1920-1964; pp. 363-364 ISBN 0405077114
- ^ Schmidt 1960, p. 130.
- ^ Schmidt 1960, pp. 138–139.
Works cited
- Schmidt, Karl (1960). Henry A. Wallace: Quixotic Crusade 1948. Syracuse University Press. ISBN 978-0-8156-0020-6.


