Type a search term to find related articles by LIMS subject matter experts gathered from the most trusted and dynamic collaboration tools in the laboratory informatics industry.
Clinton, Louisiana | |
|---|---|
Town | |
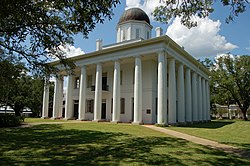
 East Feliciana Courthouse in Clinton | |
 Location of Clinton in East Feliciana Parish, Louisiana. | |
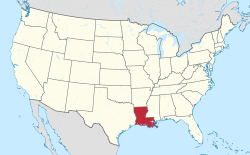
 Location of Louisiana in the United States | |
| Coordinates: 30°51′47″N 91°00′57″W / 30.86306°N 91.01583°W | |
| Country | |
| State | |
| Parish | East Feliciana |
| Government | |
| • Mayor | Mark L. Kemp (D) (elected 2020) |
| Area | |
• Total | 2.76 sq mi (7.14 km2) |
| • Land | 2.74 sq mi (7.10 km2) |
| • Water | 0.02 sq mi (0.04 km2) |
| Elevation | 226 ft (69 m) |
| Population (2020) | |
• Total | 1,340 |
| • Density | 489.05/sq mi (188.83/km2) |
| Time zone | UTC-6 (CST) |
| • Summer (DST) | UTC-5 (CDT) |
| Zip Code | 70722 |
| Area code | 225 |
| FIPS code | 22-15990 |
| GNIS feature ID | 2406280[2] |
| Website | www |
Clinton is a town in, and the parish seat of, East Feliciana Parish, Louisiana, United States.[3] The town was named for New York Governor DeWitt Clinton.[4] The population was 1,340 in 2020. It is part of the Baton Rouge metropolitan statistical area.
In 1824, when Feliciana Parish was split into East and West, Clinton became the seat of East Feliciana Parish's government, replacing the town of Jackson in this capacity.
In mid October 1948, an Air Force transport plane with 34 people aboard made a forced landing near the town, killing four.[5]
Clinton is located at 30°51′47″N 91°0′57″W / 30.86306°N 91.01583°W (30.863050, -91.015789).[6]
According to the United States Census Bureau, the town has a total area of 2.8 square miles (7.3 km2), of which 2.7 square miles (7.0 km2) is land and 0.04 square miles (0.10 km2) (0.72%) is water.
| Climate data for Clinton, Louisiana (1991–2020 normals, extremes 1975–2019) | |||||||||||||
|---|---|---|---|---|---|---|---|---|---|---|---|---|---|
| Month | Jan | Feb | Mar | Apr | May | Jun | Jul | Aug | Sep | Oct | Nov | Dec | Year |
| Record high °F (°C) | 81 (27) |
87 (31) |
89 (32) |
94 (34) |
100 (38) |
101 (38) |
102 (39) |
106 (41) |
104 (40) |
98 (37) |
90 (32) |
84 (29) |
106 (41) |
| Mean daily maximum °F (°C) | 60.1 (15.6) |
64.6 (18.1) |
70.7 (21.5) |
76.8 (24.9) |
83.3 (28.5) |
88.5 (31.4) |
90.1 (32.3) |
90.2 (32.3) |
86.9 (30.5) |
78.9 (26.1) |
69.0 (20.6) |
62.3 (16.8) |
76.8 (24.9) |
| Daily mean °F (°C) | 48.8 (9.3) |
52.7 (11.5) |
58.8 (14.9) |
65.1 (18.4) |
72.2 (22.3) |
78.4 (25.8) |
80.2 (26.8) |
80.1 (26.7) |
76.3 (24.6) |
66.8 (19.3) |
57.0 (13.9) |
51.2 (10.7) |
65.6 (18.7) |
| Mean daily minimum °F (°C) | 37.6 (3.1) |
40.9 (4.9) |
46.9 (8.3) |
53.4 (11.9) |
61.0 (16.1) |
68.2 (20.1) |
70.4 (21.3) |
70.1 (21.2) |
65.8 (18.8) |
54.8 (12.7) |
45.1 (7.3) |
40.2 (4.6) |
54.5 (12.5) |
| Record low °F (°C) | 6 (−14) |
11 (−12) |
18 (−8) |
28 (−2) |
37 (3) |
48 (9) |
55 (13) |
57 (14) |
43 (6) |
28 (−2) |
20 (−7) |
1 (−17) |
1 (−17) |
| Average precipitation inches (mm) | 5.87 (149) |
5.45 (138) |
4.86 (123) |
5.47 (139) |
4.87 (124) |
6.02 (153) |
4.69 (119) |
5.08 (129) |
4.30 (109) |
4.33 (110) |
3.70 (94) |
5.05 (128) |
59.69 (1,516) |
| Average snowfall inches (cm) | 0.0 (0.0) |
0.0 (0.0) |
0.0 (0.0) |
0.0 (0.0) |
0.0 (0.0) |
0.0 (0.0) |
0.0 (0.0) |
0.0 (0.0) |
0.0 (0.0) |
0.0 (0.0) |
0.0 (0.0) |
0.0 (0.0) |
0.0 (0.0) |
| Average precipitation days (≥ 0.01 in) | 9.6 | 8.4 | 8.3 | 7.0 | 7.5 | 10.5 | 11.6 | 9.1 | 6.4 | 5.8 | 7.1 | 8.0 | 99.3 |
| Average snowy days (≥ 0.1 in) | 0.0 | 0.0 | 0.0 | 0.0 | 0.0 | 0.0 | 0.0 | 0.0 | 0.0 | 0.0 | 0.0 | 0.1 | 0.1 |
| Source: NOAA[7][8] | |||||||||||||
| Census | Pop. | Note | %± |
|---|---|---|---|
| 1870 | 930 | — | |
| 1880 | 112 | −88.0% | |
| 1890 | 974 | 769.6% | |
| 1900 | 960 | −1.4% | |
| 1910 | 918 | −4.4% | |
| 1920 | 701 | −23.6% | |
| 1930 | 702 | 0.1% | |
| 1940 | 998 | 42.2% | |
| 1950 | 1,383 | 38.6% | |
| 1960 | 1,568 | 13.4% | |
| 1970 | 1,884 | 20.2% | |
| 1980 | 1,919 | 1.9% | |
| 1990 | 1,904 | −0.8% | |
| 2000 | 1,998 | 4.9% | |
| 2010 | 1,653 | −17.3% | |
| 2020 | 1,340 | −18.9% | |
| U.S. Decennial Census[9] | |||
| Race | Number | Percentage |
|---|---|---|
| White (non-Hispanic) | 565 | 42.16% |
| Black or African American (non-Hispanic) | 709 | 52.91% |
| Native American | 1 | 0.07% |
| Asian | 12 | 0.9% |
| Other/Mixed | 35 | 2.61% |
| Hispanic or Latino | 18 | 1.34% |
As of the 2020 United States census, there were 1,340 people, 737 households, and 506 families residing in the town.
As of the census[11] of 2000, there were 1,998 people, 670 households, and 481 families residing in the town. The population density was 729.0 inhabitants per square mile (281.5/km2). There were 771 housing units at an average density of 281.3 per square mile (108.6/km2). The racial makeup of the town was 40.74% White, 58.26% African American, 0.05% Native American, 0.15% Asian, 0.10% from other races, and 0.70% from two or more races. Hispanic or Latino of any race were 1.75% of the population.
There were 670 households, out of which 34.3% had children under the age of 18 living with them, 41.2% were married couples living together, 26.1% had a female householder with no husband present, and 28.1% were non-families. 26.6% of all households were made up of individuals, and 11.9% had someone living alone who was 65 years of age or older. The average household size was 2.71 and the average family size was 3.30.
In the town, the population was spread out, with 30.0% under the age of 18, 9.0% from 18 to 24, 27.5% from 25 to 44, 21.8% from 45 to 64, and 11.7% who were 65 years of age or older. The median age was 34 years. For every 100 females, there were 96.1 males. For every 100 females age 18 and over, there were 91.1 males.
The median income for a household in the town was $27,016, and the median income for a family was $29,444. Males had a median income of $32,500 versus $20,268 for females. The per capita income for the town was $13,353. About 25.3% of families and 33.6% of the population were below the poverty line, including 44.6% of those under age 18 and 23.7% of those age 65 or over.
East Feliciana Parish School Board serves Clinton. Public schools within Clinton and serving Clinton include:
This was changed in the Fall of 2010, when Clinton and Jackson High Schools merged to be housed at the old Jackson High/Middle School building in Jackson. Clinton Middle School was merged with Jackson Middle School and housed at the Clinton High School site.
Silliman Institute is the main private school in the area. Slaughter Community Charter School is the only charter school in the area.