Type a search term to find related articles by LIMS subject matter experts gathered from the most trusted and dynamic collaboration tools in the laboratory informatics industry.
| ||||||||||||||||||||||||||||||||||
38 of the 96 seats in the United States Senate 49 seats needed for a majority | ||||||||||||||||||||||||||||||||||
|---|---|---|---|---|---|---|---|---|---|---|---|---|---|---|---|---|---|---|---|---|---|---|---|---|---|---|---|---|---|---|---|---|---|---|
| ||||||||||||||||||||||||||||||||||
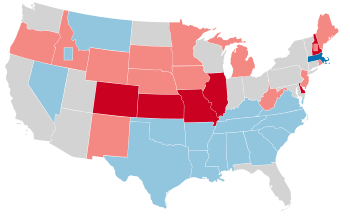 Results of the elections: Democratic gain Democratic hold Republican gain Republican hold No election | ||||||||||||||||||||||||||||||||||
| ||||||||||||||||||||||||||||||||||
The 1918 United States Senate elections were held throughout 1918,[a] the midpoint of Woodrow Wilson's second term as president. This was the first election since the ratification of the 17th Amendment that all 32 Class 2 senators were subject to direct or popular election, making them the final class under the old system of being selected by state legislatures. Special elections were also held to fill vacancies.
Republicans gained a slim 2-seat control after picking a net of 6 seats up. This came after an April 1918 special election where they flipped a seat in Wisconsin.
Three Republicans and one Democrat retired instead of seeking re-election. Two Republicans retired instead of seeking election to finish the unexpired terms, one Democrat retired instead of seeking election to a full term and two Democrats retired instead of seeking election to finish the unexpired terms.
Eight Democrats and one Republican sought re-election but lost in the primary or general election.
One Democrat died on October 21, 1917, and his seat remained vacant until an April 1918 election.
| State | Senator | Replaced by |
|---|---|---|
| Wisconsin | Paul O. Husting | Irvine Lenroot |
| State | Senator | Replaced by |
|---|---|---|
| Alabama | John H. Bankhead | Braxton B. Comer |
| Virginia | Thomas S. Martin | Carter Glass |
Source: United States Senate Official Website
| D1 | D2 | D3 | D4 | D5 | D6 | D7 | D8 | ||
| D18 | D17 | D16 | D15 | D14 | D13 | D12 | D11 | D10 | D9 |
| D19 | D20 | D21 | D22 | D23 | D24 | D25 | D26 | D27 | D28 |
| D38 Kan. Ran |
D37 Ill. Ran |
D36 Idaho Ran |
D35 Ga. Ran |
D34 Del. Ran |
D33 Colo. Ran |
D32 Ark. Ran |
D31 Ala. Ran |
D30 | D29 |
| D39 La. (reg) Ran |
D40 La. (sp) Ran |
D41 Mo. (sp) Ran |
D42 Mont. Ran |
D43 Nev. (sp) Ran |
D44 N.H. (reg) Retired |
D45 N.C. Ran |
D46 Okla. Ran |
D47 S.C. (reg) & S.C. (sp) Ran |
D48 Tenn. Ran |
| Majority → | D49 Va. Ran | ||||||||
| R39 N.J. (sp) Ran N.J. (reg) Retired |
R40 N.M. Ran |
R41 Ore. (sp) Retired Ore. (reg) Ran |
R42 R.I. Ran |
R43 S.D. Ran |
R44 Texas Ran |
R45 W.Va. Retired |
D51 Wyo. Ran |
D50 Wis. Died | |
| R38 N.H. (sp) Retired |
R37 Neb. Ran |
R36 Miss. Ran |
R35 Minn. Ran |
R34 Mich. Retired |
R33 Mass. Ran |
R32 Me. Ran |
R31 Ky. Retired |
R30 Iowa Ran |
R29 Idaho (reg) Ran |
| R19 | R20 | R21 | R22 | R23 | R24 | R25 | R26 | R27 | R28 |
| R18 | R17 | R16 | R15 | R14 | R13 | R12 | R11 | R10 | R9 |
| R1 | R2 | R3 | R4 | R5 | R6 | R7 | R8 | ||
| D1 | D2 | D3 | D4 | D5 | D6 | D7 | D8 | ||
| D18 | D17 | D16 | D15 | D14 | D13 | D12 | D11 | D10 | D9 |
| D19 | D20 | D21 | D22 | D23 | D24 | D25 | D26 | D27 | D28 |
| D38 Mass. Gain |
D37 La. (sp) Hold |
D36 La. (reg) Re-elected |
D35 Ky. Hold |
D34 Idaho Elected[c] |
D33 Ga. Hold |
D32 Ark. Re-elected |
D31 Ala. Re-elected |
D30 | D29 |
| D39 Miss. Hold |
D40 Mont. Re-elected |
D41 Nev. Elected[c] |
D42 N.C. Re-elected |
D43 Okla. Re-elected |
D44 S.C. (reg) & S.C. (sp) Hold |
D45 Tenn. Re-elected |
D46 Texas Re-elected |
D47 Va. Re-elected |
R49 Wyo. Re-elected |
| Majority → | |||||||||
| R39 Neb. Re-elected |
R40 N.H. (reg) Gain |
R41 N.H. (sp) Hold |
R42 N.J. (sp) Elected N.J. (reg) Hold |
R43 N.M. Re-elected |
R44 Ore. (sp) Hold Ore. (reg) Elected[c] |
R45 R.I. Re-elected |
R46 S.D. Re-elected |
R47 W.Va. Hold |
R48 Wis. Gain |
| R38 Mo. Gain |
R37 Minn. Re-elected |
R36 Mich. Hold |
R35 Me. Re-elected |
R34 Kan. Gain |
R33 Iowa Re-elected |
R32 Ill. Gain |
R31 Idaho (reg) Re-elected |
R30 Del. Gain |
R29 Colo. Gain |
| R19 | R20 | R21 | R22 | R23 | R24 | R25 | R26 | R27 | R28 |
| R18 | R17 | R16 | R15 | R14 | R13 | R12 | R11 | R10 | R9 |
| R1 | R2 | R3 | R4 | R5 | R6 | R7 | R8 | ||
| Key: |
|
|---|
In these special elections, the winner was seated during 1918 or before March 4, 1919; ordered by election date.
| State | Incumbent | Results | Candidates | ||
|---|---|---|---|---|---|
| Senator | Party | Electoral history | |||
| Wisconsin (Class 3) |
Paul O. Husting | Democratic | 1914 | Incumbent died October 21, 1917. New senator elected April 2, 1918. Republican gain. |
|
| Idaho (Class 3) |
John F. Nugent | Democratic | 1918 (appointed) | Interim appointee elected November 5, 1918. |
|
| Louisiana (Class 3) |
Walter Guion | Democratic | 1918 (appointed) | Interim appointee retired. New senator elected November 5, 1918. Democratic hold. |
|
| Missouri (Class 3) |
Xenophon P. Wilfley | Democratic | 1918 (appointed) | Interim appointee lost nomination. New senator elected November 5, 1918. Republican gain. |
Others
|
| Nevada (Class 3) |
Charles Henderson | Democratic | 1918 (appointed) | Interim appointee elected November 5, 1918. |
|
| New Hampshire (Class 3) |
Irving W. Drew | Republican | 1918 (appointed) | Interim appointee retired. New senator elected November 5, 1918. Republican hold. |
|
| New Jersey (Class 2) |
David Baird | Republican | 1918 (appointed) | Interim appointee elected November 5, 1918. Interim appointee was not a candidate for the next term; see below. |
|
| Oregon (Class 2) |
Charles L. McNary | Republican | 1917 (appointed) | Interim appointee retired. New senator elected November 5, 1918. Republican hold. Interim appointee was instead elected to the next term; see below. Mulkey took the seat but subsequently resigned so McNary could be re-appointed ahead of the term. |
|
| South Carolina (Class 2) |
Christie Benet | Democratic | 1918 (appointed) | Interim appointee lost renomination. New senator elected November 5, 1918. Democratic hold. Neither the interim appointee nor the winner were elected to the next term; see below. |
|
In these general elections, the winners were elected for the term beginning March 4, 1919; ordered by state.
All of the elections involved the Class 2 seats.
| State | Incumbent | Results | Candidates | ||
|---|---|---|---|---|---|
| Senator | Party | Electoral history | |||
| Alabama | John H. Bankhead | Democratic | 1907 (appointed) 1907 (special) 1911 (early) |
Incumbent re-elected. |
|
| Arkansas | Joseph T. Robinson | Democratic | 1913 | Incumbent re-elected. |
|
| Colorado | John F. Shafroth | Democratic | 1913 | Incumbent lost re-election. New senator elected. Republican gain. |
|
| Delaware | Willard Saulsbury Jr. | Democratic | 1913 | Incumbent lost re-election. New senator elected. Republican gain. |
|
| Georgia | Thomas W. Hardwick | Democratic | 1914 (special) | Incumbent lost renomination. New senator elected. Democratic hold. |
|
| Idaho | William Borah | Republican | 1907 1913 |
Incumbent re-elected. |
|
| Illinois | J. Hamilton Lewis | Democratic | 1913 (Late) | Incumbent lost re-election. New senator elected. Republican gain. |
|
| Iowa | William S. Kenyon | Republican | 1911 (special) 1913 |
Incumbent re-elected. |
|
| Kansas | William H. Thompson | Democratic | 1913 | Incumbent lost re-election. New senator elected. Republican gain. |
|
| Kentucky | George B. Martin | Democratic | 1918 (appointed) | Incumbent retired. New senator elected. Democratic hold. |
|
| Louisiana | Joseph E. Ransdell | Democratic | 1912 | Incumbent re-elected. |
|
| Maine | Bert M. Fernald | Republican | 1916 (special) | Incumbent re-elected September 9, 1918. |
|
| Massachusetts | John W. Weeks | Republican | 1913 | Incumbent lost re-election. New senator elected. Democratic gain. |
|
| Michigan | William Alden Smith | Republican | 1911 1913 |
Incumbent retired. New senator elected. Republican hold. |
Others
|
| Minnesota | Knute Nelson | Republican | 1895 1901 1907 1913 |
Incumbent re-elected. |
|
| Mississippi | James K. Vardaman | Democratic | 1912 | Incumbent lost renomination. New senator elected. |
|
| Montana | Thomas J. Walsh | Democratic | 1913 | Incumbent re-elected. |
|
| Nebraska | George W. Norris | Republican | 1913 | Incumbent re-elected. |
|
| New Hampshire | Henry F. Hollis | Democratic | 1913 | Incumbent retired. New senator elected. Republican gain. |
|
| New Jersey | David Baird | Republican | 1918 (appointed) | Interim appointee retired. New senator elected. Republican hold. Interim appointee (Baird) was elected to finish the current term; see above. |
Others
|
| New Mexico | Albert B. Fall | Republican | 1912 (new state) 1912 (Invalidated) 1913 |
Incumbent re-elected. |
|
| North Carolina | F. M. Simmons | Democratic | 1901 1907 1913 |
Incumbent re-elected. |
|
| Oklahoma | Robert L. Owen | Democratic | 1907 (New state) 1913 |
Incumbent re-elected. |
|
| Oregon | Charles L. McNary | Republican | 1917 (appointed) | Interim appointee elected to the next term but not to finish the term. Winner appointed to begin next term early when winner of the special election (see above) resigned. |
|
| Rhode Island | LeBaron B. Colt | Republican | 1913 | Incumbent re-elected. |
|
| South Carolina | Christie Benet | Democratic | 1918 (appointed) | Interim appointee retired. New senator elected. Democratic hold. Neither the interim appointee nor the winner were elected to finish the current term; see above. |
|
| South Dakota | Thomas Sterling | Republican | 1913 | Incumbent re-elected. |
|
| Tennessee | John K. Shields | Democratic | 1913 | Incumbent re-elected. |
|
| Texas | Morris Sheppard | Democratic | 1913 (special) | Incumbent re-elected. |
|
| Virginia | Thomas S. Martin | Democratic | 1893 (early) 1899 (early) 1906 1912 |
Incumbent re-elected. |
|
| West Virginia | Nathan Goff Jr. | Republican | 1913 | Incumbent retired. New senator elected. Republican hold. |
|
| Wyoming | Francis E. Warren | Republican | 1890 1893 (lost) 1895 1901 1907 1913 |
Incumbent re-elected. |
|
Eighteen races had a margin of victory under 10%:
| State | Party of winner | Margin |
|---|---|---|
| Idaho (special) | Democratic | 1.0% |
| New Hampshire (special) | Republican | 1.52%[d] |
| Kentucky | Democratic | 1.54% |
| Colorado | Republican (flip) | 1.55% |
| Michigan | Republican | 1.72% |
| Delaware | Republican (flip) | 3.34% |
| Wisconsin (special) | Republican (flip) | 3.61% |
| New Mexico | Republican | 3.92% |
| New Jersey (special) | Republican | 4.53% |
| Massachusetts | Democratic (flip) | 4.6% |
| Montana | Democratic | 5.28% |
| Rhode Island | Republican | 5.52% |
| Illinois | Republican (flip) | 5.58% |
| Missouri (special) | Republican (flip) | 6.1% |
| New Hampshire | Republican (flip) | 7.08% |
| New Jersey | Republican | 7.11% |
| West Virginia | Republican | 8.13% |
| Nebraska | Republican | 9.03% |
| |||||||||||||||||
| |||||||||||||||||
 County results Bankhead: 90–100% | |||||||||||||||||
| |||||||||||||||||
| Party | Candidate | Votes | % | |
|---|---|---|---|---|
| Democratic | John H. Bankhead (incumbent) | 54,880 | 100.00 | |
| Total votes | 54,880 | 100.00 | ||
| Democratic hold | ||||
| |||||||||||||||||
| |||||||||||||||||
 County results Robinson: 90–100% | |||||||||||||||||
| |||||||||||||||||
| Party | Candidate | Votes | % | |
|---|---|---|---|---|
| Democratic | Joseph T. Robinson (incumbent) | 78,377 | 100.00 | |
| Total votes | 78,377 | 100.00 | ||
| Democratic hold | ||||
| |||||||||||||||||
| |||||||||||||||||
 County results Phipps: 40–50% 50–60% Shafroth: 40–50% 50–60% 60–70% 70–80% | |||||||||||||||||
| |||||||||||||||||
| Party | Candidate | Votes | % | |
|---|---|---|---|---|
| Republican | Lawrence C. Phipps | 107,726 | 49.49 | |
| Democratic | John F. Shafroth (incumbent) | 104,347 | 47.94 | |
| Prohibition | P. A. Richardson | 5,606 | 2.58 | |
| Majority | 3,379 | 1.55 | ||
| Total votes | 217,679 | 100.00 | ||
| Republican gain from Democratic | ||||
| |||||||||||||||||
| |||||||||||||||||
| |||||||||||||||||
| |||||||||||||||||
| |||||||||||||||||
| |||||||||||||||||
| |||||||||||||||||
| |||||||||||||||||
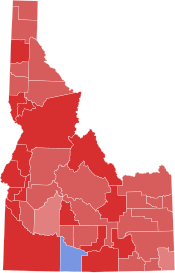 County results Borah: 50–60% 60–70% 70–80% Moore: 50–60% | |||||||||||||||||
| |||||||||||||||||
| |||||||||||||||||
| |||||||||||||||||
 County results Nugent: 50–60% 60–70% Gooding: 50–60% 60–70% | |||||||||||||||||
| |||||||||||||||||
Incumbent Democratic Senator John Frost Nugent defeated Republican nominee Frank Robert Gooding by a very narrow margin of 1.00% and by 970 votes. Upon his election, John Frost Nugent became the first Democrat ever to have been elected to the United States Senate in Idaho or from Idaho and the first non-Republican to win a United States Senate seat in Idaho or from Idaho since 1901 and the first non-Republican to win the Class 3 Senate seat in Idaho or from Idaho since 1897.
| |||||||||||||||||
| |||||||||||||||||
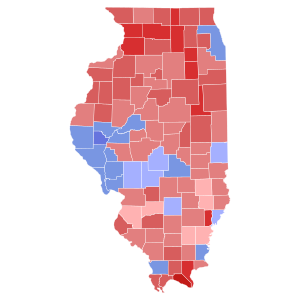 Results by county McCormick: 40–50% 50–60% 60–70% 70–80% 80–90% Lewis: 40–50% 50–60% 60–70% | |||||||||||||||||
| |||||||||||||||||
| Party | Candidate | Votes | % | |
|---|---|---|---|---|
| Republican | Medill McCormick | 479,983 | 50.50 | |
| Democratic | James Hamilton Lewis (incumbent) | 426,943 | 44.92 | |
| Socialist | William Bross Lloyd | 37,167 | 3.91 | |
| Socialist Labor | John M. Francis | 3,268 | 0.34 | |
| Prohibition | Frank B. Vennum | 3,151 | 0.33 | |
| Majority | 53,024 | 5.58 | ||
| Turnout | 950,496 | |||
| Republican gain from Democratic | ||||
| |||||||||||||||||
| |||||||||||||||||
 Results by county Kenyon: 50–60% 60–70% 70–80% 80–90% Keyes: 50–60% | |||||||||||||||||
| |||||||||||||||||
| |||||||||||||||||
| |||||||||||||||||
 Results by county Capper: 40–50% 50–60% 60–70% 70–80% 80–90% Thompson: 40–50% 50–60% | |||||||||||||||||
| |||||||||||||||||
| |||||||||||||||||
| |||||||||||||||||
 County results Stanley: 50–60% 60–70% 70–80% 80–90% Bruner: 50–60% 60–70% 70–80% 80–90% >90% | |||||||||||||||||
| |||||||||||||||||
| |||||||||||||||||
| |||||||||||||||||
 Parish results Ransdell: 90–100% | |||||||||||||||||
| |||||||||||||||||
| |||||||||||||||||
| |||||||||||||||||
 Parish results Gay: 90–100% | |||||||||||||||||
| |||||||||||||||||
| |||||||||||||||||
| |||||||||||||||||
 County results Fernald: 50–60% 60–70% Newbert: 50–60% | |||||||||||||||||
| |||||||||||||||||
| |||||||||||||||||||||
| |||||||||||||||||||||
 County results Walsh: 40–50% 50–60% 60–70% Weeks: 40–50% 50–60% 60–70% | |||||||||||||||||||||
| |||||||||||||||||||||
| |||||||||||||||||
| Turnout | 15.60% | ||||||||||||||||
|---|---|---|---|---|---|---|---|---|---|---|---|---|---|---|---|---|---|
| |||||||||||||||||
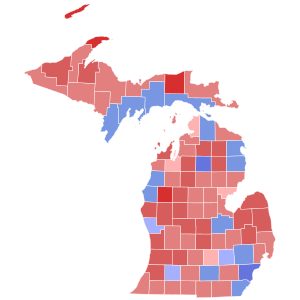 County Results Newberry: 40–50% 50–60% 60–70% 70–80% Ford: 40-50% 50–60% 60–70% | |||||||||||||||||
| |||||||||||||||||
| Republican | Truman H. Newberry | 220,054 | 50.19% | ||
| Democratic | Henry Ford | 212,487 | 48.47% | ||
| Socialist | Edward O. Foss | 4,763 | 1.09% | ||
| Prohibition | William J. Faull | 1,133 | 0.26% | ||
| Party | Candidate | Votes | % | ||
|---|---|---|---|---|---|
| Majority | 7,567 | 1.72 | |||
| Total votes | 438,437 | 100.00 | |||
| Republican hold | |||||
| |||||||||||||||||
| |||||||||||||||||
 County results Nelson: 50–60% 60–70% 70-80% Calderwood: 50-60% 60-70% | |||||||||||||||||
| |||||||||||||||||
| Party | Candidate | Votes | % | |
|---|---|---|---|---|
| Republican | Knute Nelson (incumbent) | 206,428 | 60.05 | |
| National | Willis Calderwood | 137,334 | 39.95 | |
| Majority | 69,094 | 20.10 | ||
| Total votes | 343,762 | 100.00 | ||
| Republican hold | ||||
| |||||||||||||||||||||
| |||||||||||||||||||||
 County results Harrison: 40–50% 50–60% 60–70% 70–80% 80–90% Vardaman: 40–50% 50–60% 60-70% 70-80% Noel: 50-60% | |||||||||||||||||||||
| |||||||||||||||||||||
| |||||||||||||||||
| |||||||||||||||||
 County results Spencer: 40–50% 50–60% 60–70% 70–80% 80–90% Folk: 40–50% 50–60% 60–70% 70–80% 80–90% | |||||||||||||||||
| |||||||||||||||||
| |||||||||||||||||||||
| |||||||||||||||||||||
 County results Walsh: 30–40% 40–50% 50–60% Lanstrum: 30–40% 40–50% 50–60% Rankin: 30–40% 40–50% No Data/Vote: | |||||||||||||||||||||
| |||||||||||||||||||||
| |||||||||||||||||
| |||||||||||||||||
 County results Norris: 50–60% 60–70% Morehead: 50–60% 60–70% | |||||||||||||||||
| |||||||||||||||||
| |||||||||||||||||||||
| |||||||||||||||||||||
 Results by county Henderson: 30–40% 40–50% 50–60% 60–70% Roberts: 40–50% 50–60% | |||||||||||||||||||||
| |||||||||||||||||||||
| |||||||||||||||||
| |||||||||||||||||
Keyes: 50–60% 60–70% 70–80% 80–90% >90% Reed: 50–60% 60–70% 70–80% Tie: 50% | |||||||||||||||||
| |||||||||||||||||
| |||||||||||||||||
| |||||||||||||||||
Moses: 50–60% 60–70% 70–80% 80–90% >90% Jameson: 50–60% 60–70% 70–80% Tied: 50% | |||||||||||||||||
| |||||||||||||||||
| |||||||||||||||||
| |||||||||||||||||
 Results by county Edge: 40-50% 50-60% 60-70% 70-80% Monte: 40-50% 50-60% 60-70% | |||||||||||||||||
| |||||||||||||||||
| |||||||||||||||||
| |||||||||||||||||
 Results by county Baird: 40-50% 50-60% 60-70% 70-80% Hennessy: 40-50% 50-60% 60-70% | |||||||||||||||||
| |||||||||||||||||
| |||||||||||||||||
| |||||||||||||||||
 Results by county Fall: 50-60% 60-70% 80-90% Walton: 50-60% 60-70% 70-80% 80-90% 90-100% | |||||||||||||||||
| |||||||||||||||||
| |||||||||||||||||
| |||||||||||||||||
 Results by county Simmons: 50-60% 60-70% 70-80% 80-90% 90-100% Morehead II: 50-60% 60-70% 70-80% | |||||||||||||||||
| |||||||||||||||||
| |||||||||||||||||
| |||||||||||||||||
 County results Owen: 40–50% 50–60% 60–70% 70–80% 80–90% Johnson: 40–50% 50–60% | |||||||||||||||||
| |||||||||||||||||
| |||||||||||||||||
| |||||||||||||||||
 Results by county McNary: 40-50% 50-60% 60-70% West: 40-50% 50-60% | |||||||||||||||||
| |||||||||||||||||
| |||||||||||||||||
| |||||||||||||||||
 Results by county Mulkey: 70-80% 80-90% 90-100% | |||||||||||||||||
| |||||||||||||||||
| |||||||||||||||||
| |||||||||||||||||
| |||||||||||||||||
| ||||||||||||||||
| ||||||||||||||||
| ||||||||||||||||
| Party | Candidate | Votes | % | |
|---|---|---|---|---|
| Democratic | Nathaniel B. Dial | 65,064 | 58.70 | |
| Democratic | Cole L. Blease | 40,456 | 36.50 | |
| Democratic | James F. Rice | 5,317 | 4.80 | |
| Majority | 24,608 | 22.20 | ||
| Total votes | 110,837 | 100.00 | ||
| Democratic hold | ||||
| |||||||||||||||||
| |||||||||||||||||
| |||||||||||||||||
| Party | Candidate | Votes | % | |
|---|---|---|---|---|
| Democratic | William P. Pollock | 38,816 | 34.91 | |
| Democratic | Thomas H. Peeples | 37,567 | 33.79 | |
| Democratic | Christie Benet (incumbent) | 34,807 | 31.30 | |
| Total votes | 111,190 | 100.00 | ||
| Party | Candidate | Votes | % | |
|---|---|---|---|---|
| Democratic | William P. Pollock | 49,920 | 62.43 | |
| Democratic | Thomas H. Peeples | 30,044 | 37.57 | |
| Majority | 19,876 | 24.86 | ||
| Total votes | 79,964 | 100.00 | ||
| Democratic hold | ||||
| |||||||||||||||||||||
| |||||||||||||||||||||
 County results Sterling: 40–50% 50–60% 60–70% 70–80% Rinehart: 40–50% 50–60% 60–70% 70–80% No Vote: | |||||||||||||||||||||
| |||||||||||||||||||||
| |||||||||||||||||
| |||||||||||||||||
| |||||||||||||||||
| Party | Candidate | Votes | % | |
|---|---|---|---|---|
| Democratic | John K. Shields (incumbent) | 98,605 | 62.17% | |
| Republican | Henry Clay Evans | 59,989 | 37.83% | |
| Total votes | 158,594 | 100.00% | ||
| |||||||||||||||||
| |||||||||||||||||
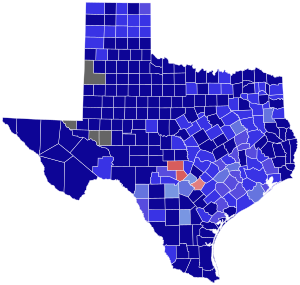 | |||||||||||||||||
| |||||||||||||||||
| |||||||||||||||||
| |||||||||||||||||
| |||||||||||||||||
| |||||||||||||||||
 County results Elkins: 50–60% 60–70% 70–80% 80–90% Watson: 50–60% 60–70% 70–80% | |||||||||||||||||
| |||||||||||||||||
| |||||||||||||||||||||
| |||||||||||||||||||||
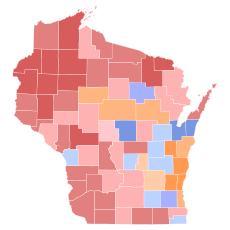 Results by county Lenroot: 30–40% 40–50% 50–60% 60–70% Davies: 30–40% 40–50% 50–60% Berger: 30–40% 40–50% 50–60% | |||||||||||||||||||||
| |||||||||||||||||||||
| Party | Candidate | Votes | % | |
|---|---|---|---|---|
| Republican | Irvine Lenroot | 163,983 | 38.73 | |
| Democratic | Joseph E. Davies | 148,923 | 35.12 | |
| Socialist | Victor L. Berger | 110,487 | 26.09 | |
| Prohibition | Anthony J. Benjamin | 233 | 0.06 | |
| Write-in | Scattering | 371 | 0.06 | |
| Majority | 15,060 | 3.61 | ||
| Total votes | 423,997 | 100.00 | ||
| Republican gain from Democratic | ||||
| |||||||||||||||||
| |||||||||||||||||
 County results Warren: 50–60% 60–70% Osborne: 50–60% No Data/Vote: | |||||||||||||||||
| |||||||||||||||||
{{cite book}}: CS1 maint: location missing publisher (link)