Infrastructure tools to support an effective radiation oncology learning health system

Original file (1,394 × 594 pixels, file size: 135 KB, MIME type: image/jpeg)
Summary
| Description |
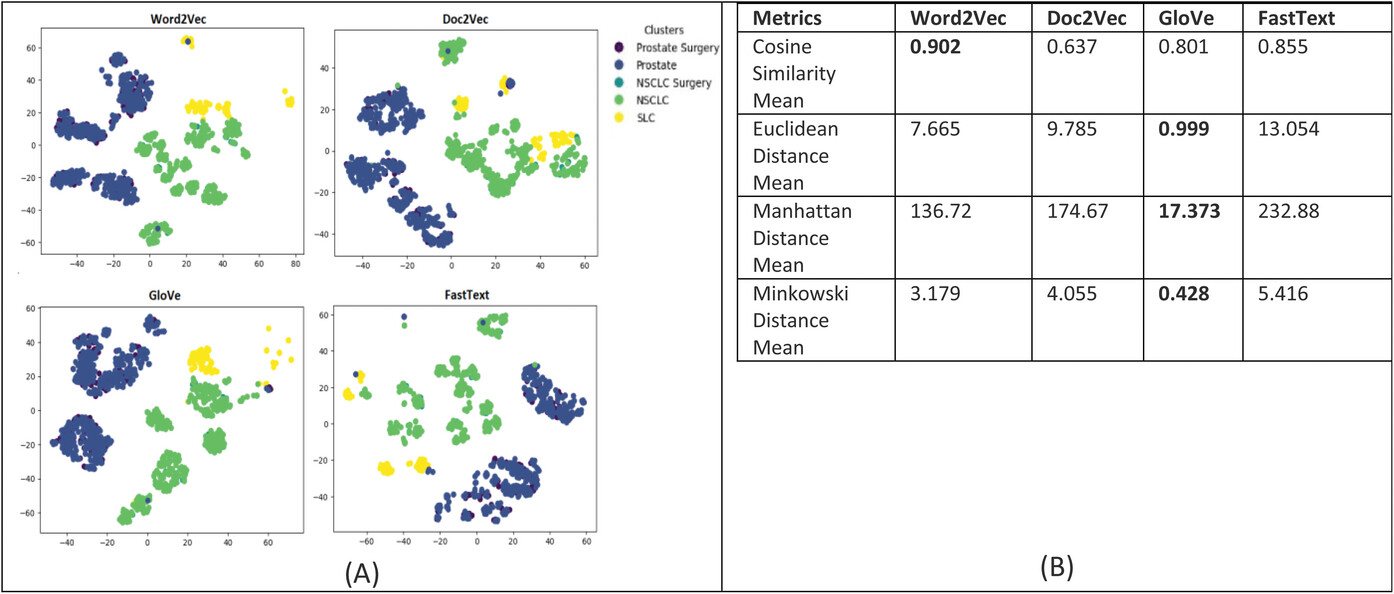
Figure 8. (A) Annotation embeddings produced by Word2Vec, Doc2Vec, GloVe, and FastText, a 2D-image of the embeddings projected down to three dimensions using the T-SNE technique. Each point indicates one patient, and color of a point indicates the cohort of the patient based on the diagnosis-based cluster. A good visualization result is that the points of the same color are near each other. (B) Results of the evaluation metrics used to measure patient similarity. The Word2Vec model had the best cosine similarity, and the GloVe model had the best Euclidean, Manhattan, and Minkowski distance, suggesting that patient embeddings derived from this model were more compact and closer in proximity. |
|---|---|
| Source |
Kapoor, Rishabh; Sleeman IV, William C.; Ghosh, Preetam; Palta, Jatinder (2023). "Infrastructure tools to support an effective radiation oncology learning health system". Journal of Applied Clinical Medical Physics 24 (10): e14127. doi:10.1002/acm2.14127. |
| Date |
2023 |
| Author |
Kapoor, Rishabh; Sleeman IV, William C.; Ghosh, Preetam; Palta, Jatinder |
| Permission (Reusing this file) |
|
| Other versions |
Licensing
File history
Click on a date/time to view the file as it appeared at that time.
| Date/Time | Thumbnail | Dimensions | User | Comment | |
|---|---|---|---|---|---|
| current | 00:40, 10 May 2024 |  | 1,394 × 594 (135 KB) | Shawndouglas (talk | contribs) |
You cannot overwrite this file.
File usage
The following page uses this file:


