Informatics Educational Institutions & Programs
Contents
| ||||||||||||||||||||||||||
| ||||||||||||||||||||||||||
 County Results
Nixon 50-60% 60-70% 70-80% 80-90%
| ||||||||||||||||||||||||||
| ||||||||||||||||||||||||||
| Elections in Wyoming |
|---|
 |
The 1972 United States presidential election in Wyoming took place on November 7, 1972. All 50 states and the District of Columbia were part of the 1972 United States presidential election. State voters chose three electors to the Electoral College, who voted for president and vice president.
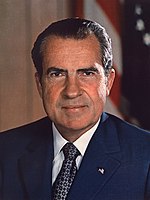
Wyoming was won by the Republican nominees, incumbent President Richard Nixon of California and his running mate Vice President Spiro Agnew of Maryland. Nixon and Agnew defeated the Democratic nominees, Senator George McGovern of South Dakota and his running mate U.S. Ambassador Sargent Shriver of Maryland.
Nixon carried Wyoming with 69.01 percent of the vote to McGovern's 30.47 percent, a victory margin of 38.54 points.[1] In a state that would reflect McGovern's national results, the Democratic nominee did not win a single county in Wyoming, making Nixon the first Republican to carry Sweetwater County and thus to sweep all of Wyoming's counties since Warren G. Harding in 1920.[2]
Results
| Party | Candidate | Votes | % | |
|---|---|---|---|---|
| Republican | Richard Nixon (inc.) | 100,464 | 69.01% | |
| Democratic | George McGovern | 44,358 | 30.47% | |
| Independent | John G. Schmitz (write-in) | 748 | 0.52% | |
| Total votes | 145,570 | 100.00% | ||
Results by county
| County[3] | Richard Nixon Republican |
George McGovern Democrat |
John G. Schmitz Independent |
Margin | Total votes cast | ||||
|---|---|---|---|---|---|---|---|---|---|
| # | % | # | % | # | % | # | % | ||
| Albany | 7,021 | 58.92% | 4,873 | 40.89% | 23 | 0.19% | 2,148 | 18.03% | 11,917 |
| Big Horn | 3,244 | 75.44% | 1,049 | 24.40% | 7 | 0.16% | 2,195 | 51.04% | 4,300 |
| Campbell | 2,953 | 78.64% | 783 | 20.85% | 19 | 0.51% | 2,170 | 57.79% | 3,755 |
| Carbon | 4,037 | 63.69% | 2,292 | 36.16% | 10 | 0.16% | 1,745 | 27.53% | 6,339 |
| Converse | 2,312 | 77.06% | 682 | 22.73% | 6 | 0.20% | 1,630 | 54.33% | 3,000 |
| Crook | 1,760 | 83.41% | 339 | 16.07% | 11 | 0.52% | 1,421 | 67.34% | 2,110 |
| Fremont | 7,359 | 69.12% | 3,248 | 30.51% | 40 | 0.38% | 4,111 | 38.61% | 10,647 |
| Goshen | 3,629 | 70.27% | 1,515 | 29.34% | 20 | 0.39% | 2,114 | 40.93% | 5,164 |
| Hot Springs | 1,678 | 70.89% | 689 | 29.11% | 0 | 0.00% | 989 | 40.78% | 2,367 |
| Johnson | 2,203 | 83.13% | 436 | 16.45% | 11 | 0.42% | 1,767 | 66.68% | 2,650 |
| Laramie | 15,010 | 65.67% | 7,791 | 34.09% | 54 | 0.24% | 7,219 | 31.58% | 22,855 |
| Lincoln | 2,459 | 67.08% | 969 | 26.43% | 238 | 6.49% | 1,490 | 40.65% | 3,666 |
| Natrona | 15,649 | 70.49% | 6,514 | 29.34% | 37 | 0.16% | 9,135 | 41.15% | 22,200 |
| Niobrara | 1,245 | 81.00% | 289 | 18.80% | 3 | 0.20% | 956 | 62.20% | 1,537 |
| Park | 5,890 | 74.79% | 1,950 | 24.76% | 35 | 0.44% | 3,940 | 50.03% | 7,875 |
| Platte | 2,200 | 70.35% | 925 | 29.58% | 2 | 0.06% | 1,275 | 40.77% | 3,127 |
| Sheridan | 6,432 | 69.03% | 2,874 | 30.84% | 12 | 0.13% | 3,558 | 38.19% | 9,318 |
| Sublette | 1,348 | 81.55% | 304 | 18.39% | 1 | 0.06% | 1,044 | 63.16% | 1,653 |
| Sweetwater | 5,175 | 58.05% | 3,713 | 41.65% | 27 | 0.30% | 1,462 | 16.40% | 8,915 |
| Teton | 2,182 | 70.03% | 810 | 25.99% | 124 | 3.98% | 1,372 | 44.04% | 3,116 |
| Uinta | 2,011 | 67.03% | 968 | 32.27% | 21 | 0.70% | 1,043 | 34.76% | 3,000 |
| Washakie | 2,604 | 75.92% | 825 | 24.05% | 1 | 0.03% | 1,779 | 51.87% | 3,430 |
| Weston | 2,063 | 78.47% | 520 | 19.78% | 46 | 1.75% | 1,543 | 58.69% | 2,629 |
| Totals | 100,464 | 69.01% | 44,358 | 30.47% | 748 | 0.51% | 56,106 | 38.54% | 145,570 |
Counties that flipped from Democratic to Republican
See also
References
- ^ 1972 Presidential General Election Results – Wyoming
- ^ Menendez, Albert J.; The Geography of Presidential Elections in the United States, 1868-2004, pp. 342-343 ISBN 0786422173
- ^ a b Wyoming Secretary of State (1973). "Official Vote - General Election, November 7, 1972". 1973 Wyoming Official Directory and 1972 Election Returns. p. 91. Retrieved 18 October 2024.


