Histopathology image classification: Highlighting the gap between manual analysis and AI automation

Original file (1,772 × 622 pixels, file size: 313 KB, MIME type: image/jpeg)
Summary
| Description |
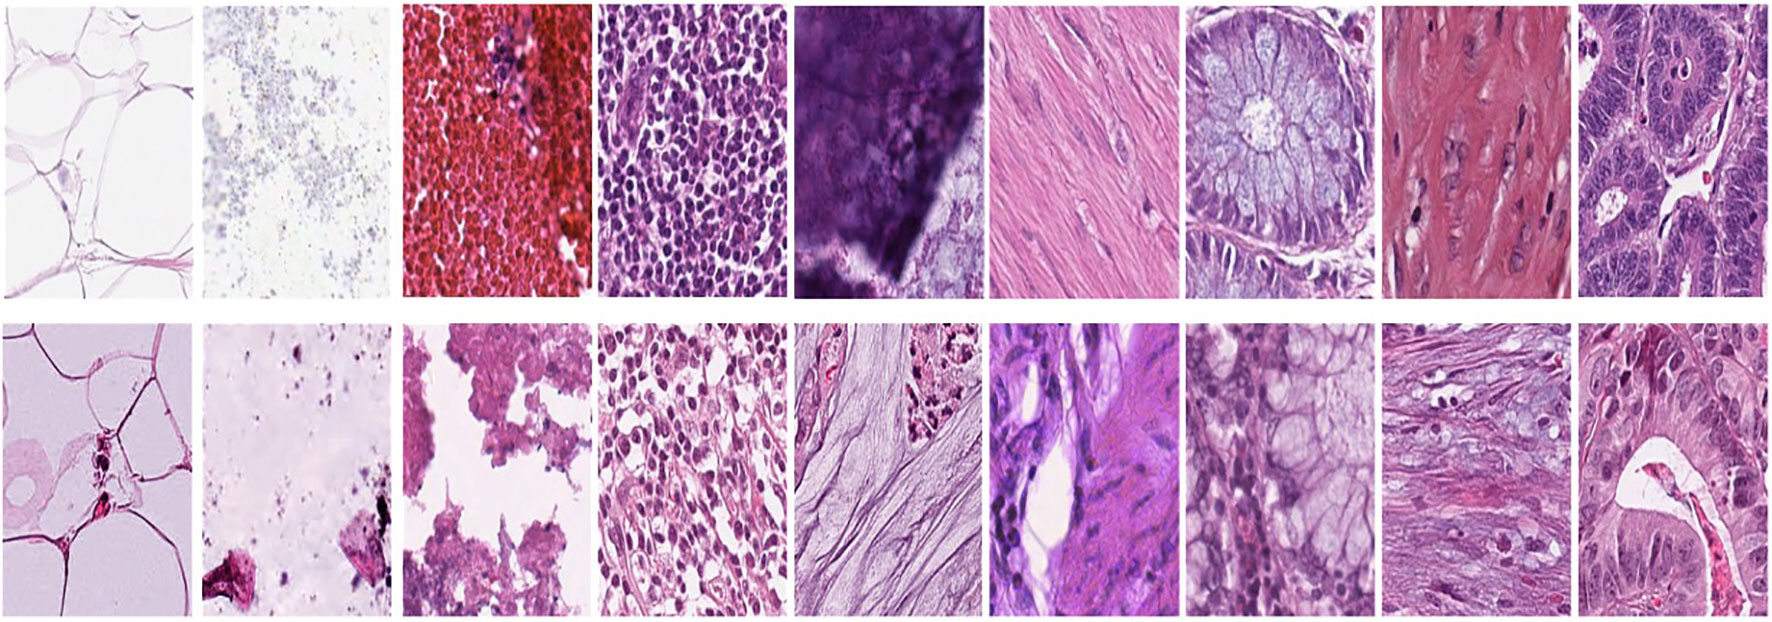
Figure 2. First row represents Adipose (ADI), background (BACK), debris (DEB), lymphocytes (LYM), mucus (MUC), smooth muscle (MUS), normal colonic mucosa (NORM), cancer-associated stroma (STR), and colorectal adenocarcinoma epithelium (TUM). The second row data set was obtained by applying normalization to the same tissue examples in the first row. |
|---|---|
| Source |
Doğan, Refika S.; Yılmaz, Bülent (2024). "Histopathology image classification: Highlighting the gap between manual analysis and AI automation". Frontiers in Oncology 13: 1325271. doi:10.3389/fonc.2023.1325271. |
| Date |
2024 |
| Author |
Doğan, Refika S.; Yılmaz, Bülent |
| Permission (Reusing this file) |
|
| Other versions |
Licensing
File history
Click on a date/time to view the file as it appeared at that time.
| Date/Time | Thumbnail | Dimensions | User | Comment | |
|---|---|---|---|---|---|
| current | 20:58, 20 May 2024 | 1,772 × 622 (313 KB) | Shawndouglas (talk | contribs) |
You cannot overwrite this file.
File usage
The following page uses this file:


