Effects of the storage conditions on the stability of natural and synthetic cannabis in biological matrices for forensic toxicology analysis: An update from the literature
Contents
Appearance
Lingyun
凌云县 | |
|---|---|
| Coordinates: 24°24′N 106°31′E / 24.400°N 106.517°E | |
| Country | China |
| Province | Guangxi |
| Prefecture-level city | Baise |
| Area | |
| • Total | 2,306 km2 (890 sq mi) |
| Population (2020) | |
| • Total | 188,194 |
| • Density | 82/km2 (210/sq mi) |
| Time zone | UTC+8 (China Standard) |
| Website | http://www.lingyun.gov.cn/ |
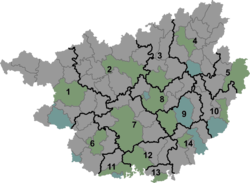
Lingyun County (simplified Chinese: 凌云县; traditional Chinese: 凌雲縣; pinyin: Língyún Xiàn) is a county in the northwest of Guangxi, China. It is under the administration of Baise city.[1][2][3]
Administrative divisions
Lingyun County is divided into 4 towns and 4 ethnic townships:[4]
- towns
- Sicheng Town 泗城镇
- Luolou Town 逻楼镇
- Jiayou Town 加尤镇
- Xiajia Town 下甲镇
- ethnic townships
- Lingzhan Yao Ethnic Township 伶站瑶族乡
- Chaoli Yao Ethnic Township 朝里瑶族乡
- Shali Yao Ethnic Township 沙里瑶族乡
- Yuhong Yao Ethnic Township 玉洪瑶族乡
Climate
| Climate data for Lingyun, elevation 438 m (1,437 ft), (1991–2018 normals, extremes 1981–2010) | |||||||||||||
|---|---|---|---|---|---|---|---|---|---|---|---|---|---|
| Month | Jan | Feb | Mar | Apr | May | Jun | Jul | Aug | Sep | Oct | Nov | Dec | Year |
| Record high °C (°F) | 28.7 (83.7) |
33.4 (92.1) |
35.5 (95.9) |
38.9 (102.0) |
38.9 (102.0) |
36.5 (97.7) |
37.5 (99.5) |
37.4 (99.3) |
37.3 (99.1) |
33.6 (92.5) |
31.4 (88.5) |
29.5 (85.1) |
38.9 (102.0) |
| Mean daily maximum °C (°F) | 16.1 (61.0) |
19.0 (66.2) |
22.7 (72.9) |
27.8 (82.0) |
30.0 (86.0) |
31.2 (88.2) |
31.9 (89.4) |
32.3 (90.1) |
30.5 (86.9) |
26.7 (80.1) |
22.9 (73.2) |
18.3 (64.9) |
25.8 (78.4) |
| Daily mean °C (°F) | 12.0 (53.6) |
14.4 (57.9) |
17.9 (64.2) |
22.5 (72.5) |
24.9 (76.8) |
26.4 (79.5) |
26.9 (80.4) |
26.6 (79.9) |
24.7 (76.5) |
21.5 (70.7) |
17.5 (63.5) |
13.4 (56.1) |
20.7 (69.3) |
| Mean daily minimum °C (°F) | 9.4 (48.9) |
11.5 (52.7) |
14.7 (58.5) |
18.8 (65.8) |
21.3 (70.3) |
23.3 (73.9) |
23.8 (74.8) |
23.3 (73.9) |
21.3 (70.3) |
18.3 (64.9) |
14.2 (57.6) |
10.3 (50.5) |
17.5 (63.5) |
| Record low °C (°F) | −0.3 (31.5) |
1.4 (34.5) |
2.3 (36.1) |
8.8 (47.8) |
11.0 (51.8) |
15.0 (59.0) |
16.9 (62.4) |
17.6 (63.7) |
11.5 (52.7) |
7.6 (45.7) |
3.0 (37.4) |
−1.6 (29.1) |
−1.6 (29.1) |
| Average precipitation mm (inches) | 24.4 (0.96) |
19.7 (0.78) |
39.2 (1.54) |
77.9 (3.07) |
231.0 (9.09) |
375.8 (14.80) |
378.6 (14.91) |
289.7 (11.41) |
145.6 (5.73) |
81.0 (3.19) |
43.2 (1.70) |
23.2 (0.91) |
1,729.3 (68.09) |
| Average precipitation days (≥ 0.1 mm) | 7.3 | 6.6 | 9.3 | 11.2 | 14.7 | 18.7 | 20.1 | 18.5 | 11.9 | 10.1 | 7.7 | 5.7 | 141.8 |
| Average snowy days | 0.4 | 0.1 | 0 | 0 | 0 | 0 | 0 | 0 | 0 | 0 | 0 | 0.3 | 0.8 |
| Average relative humidity (%) | 73 | 71 | 71 | 71 | 74 | 80 | 82 | 81 | 78 | 77 | 76 | 73 | 76 |
| Mean monthly sunshine hours | 55.6 | 66.8 | 88.3 | 117.4 | 132.4 | 111.5 | 140.0 | 167.1 | 144.8 | 109.9 | 107.1 | 84.9 | 1,325.8 |
| Percent possible sunshine | 17 | 21 | 24 | 31 | 32 | 27 | 34 | 42 | 40 | 31 | 33 | 26 | 30 |
| Source: China Meteorological Administration[5][6] | |||||||||||||
References
- ^ "China | Population: Guangxi: Baise: Lingyun | Economic Indicators". www.ceicdata.com. Retrieved 2020-07-09.
- ^ "凌云简介 - 凌云概况 - 广西百色凌云县人民政府门户网站 - www.lingyun.gov.cn". www.lingyun.gov.cn (in Simplified Chinese). Retrieved 2020-07-09.
- ^ "凌云县简介,凌云新闻,凌云风光图片,凌云下辖乡镇 / 县域频道 - 广西县域经济网". www.gxcounty.com (in Simplified Chinese). Retrieved 2020-07-09.
- ^ 2023年统计用区划代码和城乡划分代码:凌云县 (in Simplified Chinese). National Bureau of Statistics of China.
- ^ 中国气象数据网 – WeatherBk Data (in Simplified Chinese). China Meteorological Administration. Retrieved 28 May 2023.
- ^ 中国气象数据网 (in Simplified Chinese). China Meteorological Administration. Retrieved 28 May 2023.


