


Characterization of trichome phenotypes to assess maturation and flower development in Cannabis sativa L. by automatic trichome gland analysis
Original file (3,178 × 794 pixels, file size: 202 KB, MIME type: image/jpeg)
Summary
| Description |
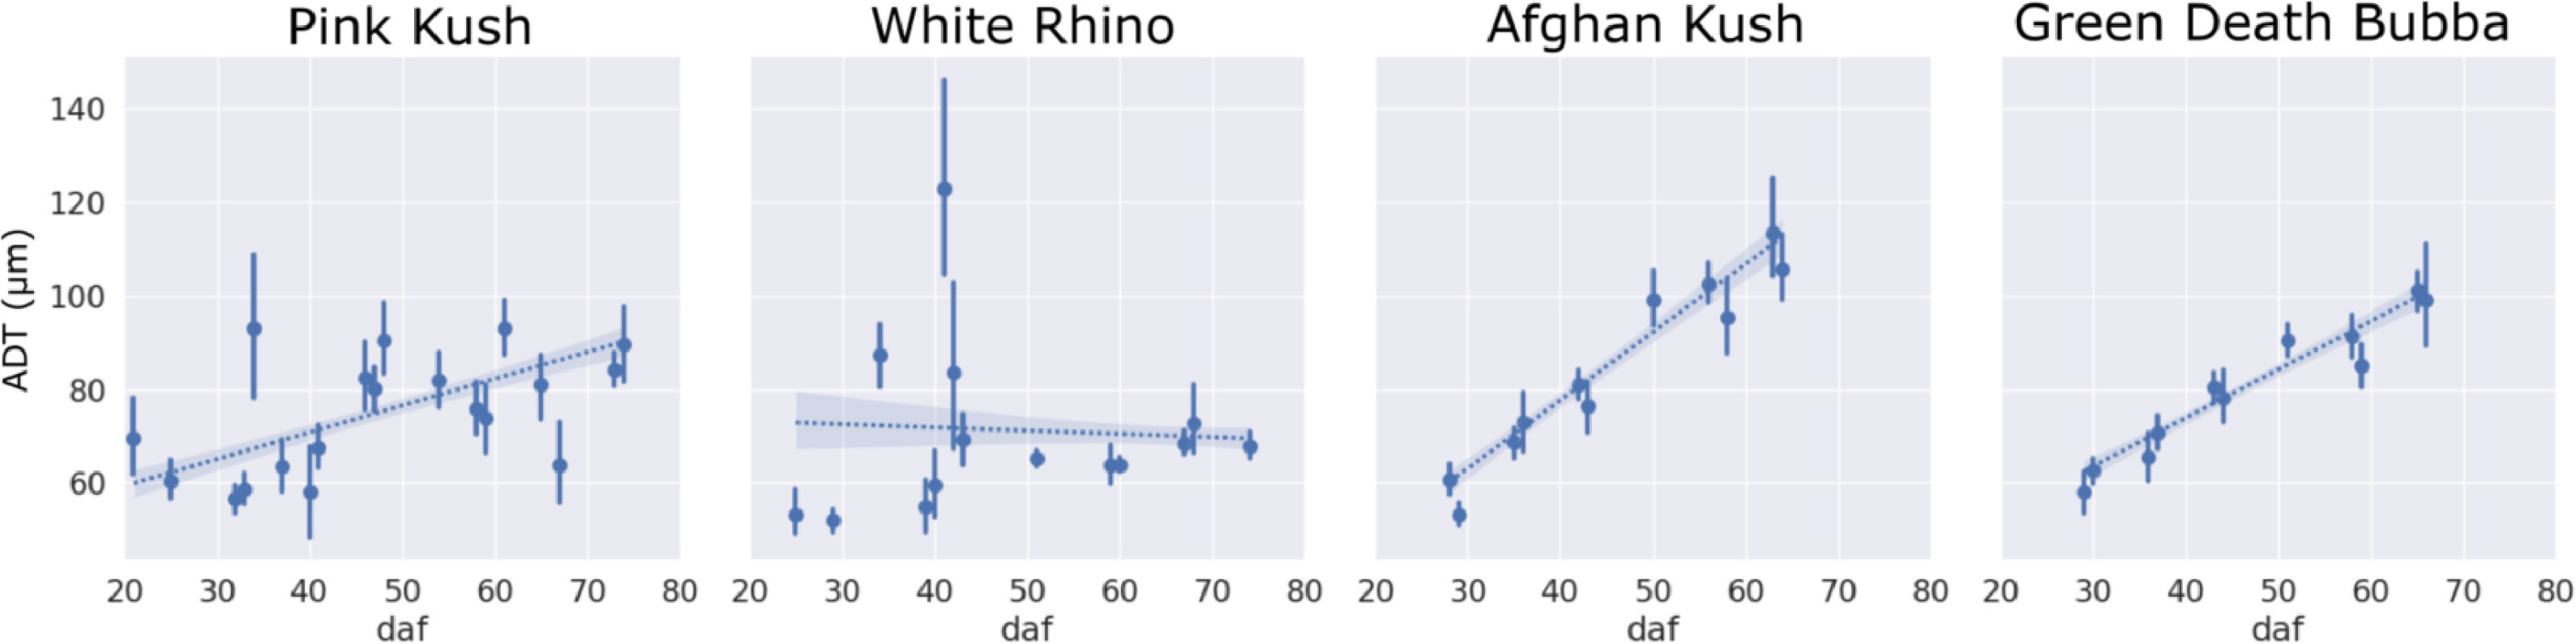
Fig. 9 Average distance to the nearest trichome (ADT). For each photographed bract image, the average distance to the nearest trichome was computed. Points are the mean of all bract tissue samples observed, with error bars representing the standard deviation of the mean. Linear regression lines display 95% confidence intervals as transparent bands. |
|---|---|
| Source |
Sutton, D.B.; Punja, Z.K.; Hamarneh, G. (2023). "Characterization of trichome phenotypes to assess maturation and flower development in Cannabis sativa L. (cannabis) by automatic trichome gland analysis". Smart Agricultural Technology 3: 100111. doi:10.1016/j.atech.2022.100111. |
| Date |
2023 |
| Author |
Sutton, D.B.; Punja, Z.K.; Hamarneh, G. |
| Permission (Reusing this file) |
Creative Commons Attribution-NonCommercial-NoDerivatives 4.0 International |
| Other versions |
Licensing
File history
Click on a date/time to view the file as it appeared at that time.
| Date/Time | Thumbnail | Dimensions | User | Comment | |
|---|---|---|---|---|---|
| current | 17:08, 7 June 2023 | 3,178 × 794 (202 KB) | Shawndouglas (talk | contribs) |
You cannot overwrite this file.
File usage
The following page uses this file:

