


Characterization of trichome phenotypes to assess maturation and flower development in Cannabis sativa L. by automatic trichome gland analysis
Original file (3,201 × 805 pixels, file size: 284 KB, MIME type: image/jpeg)
Summary
| Description |
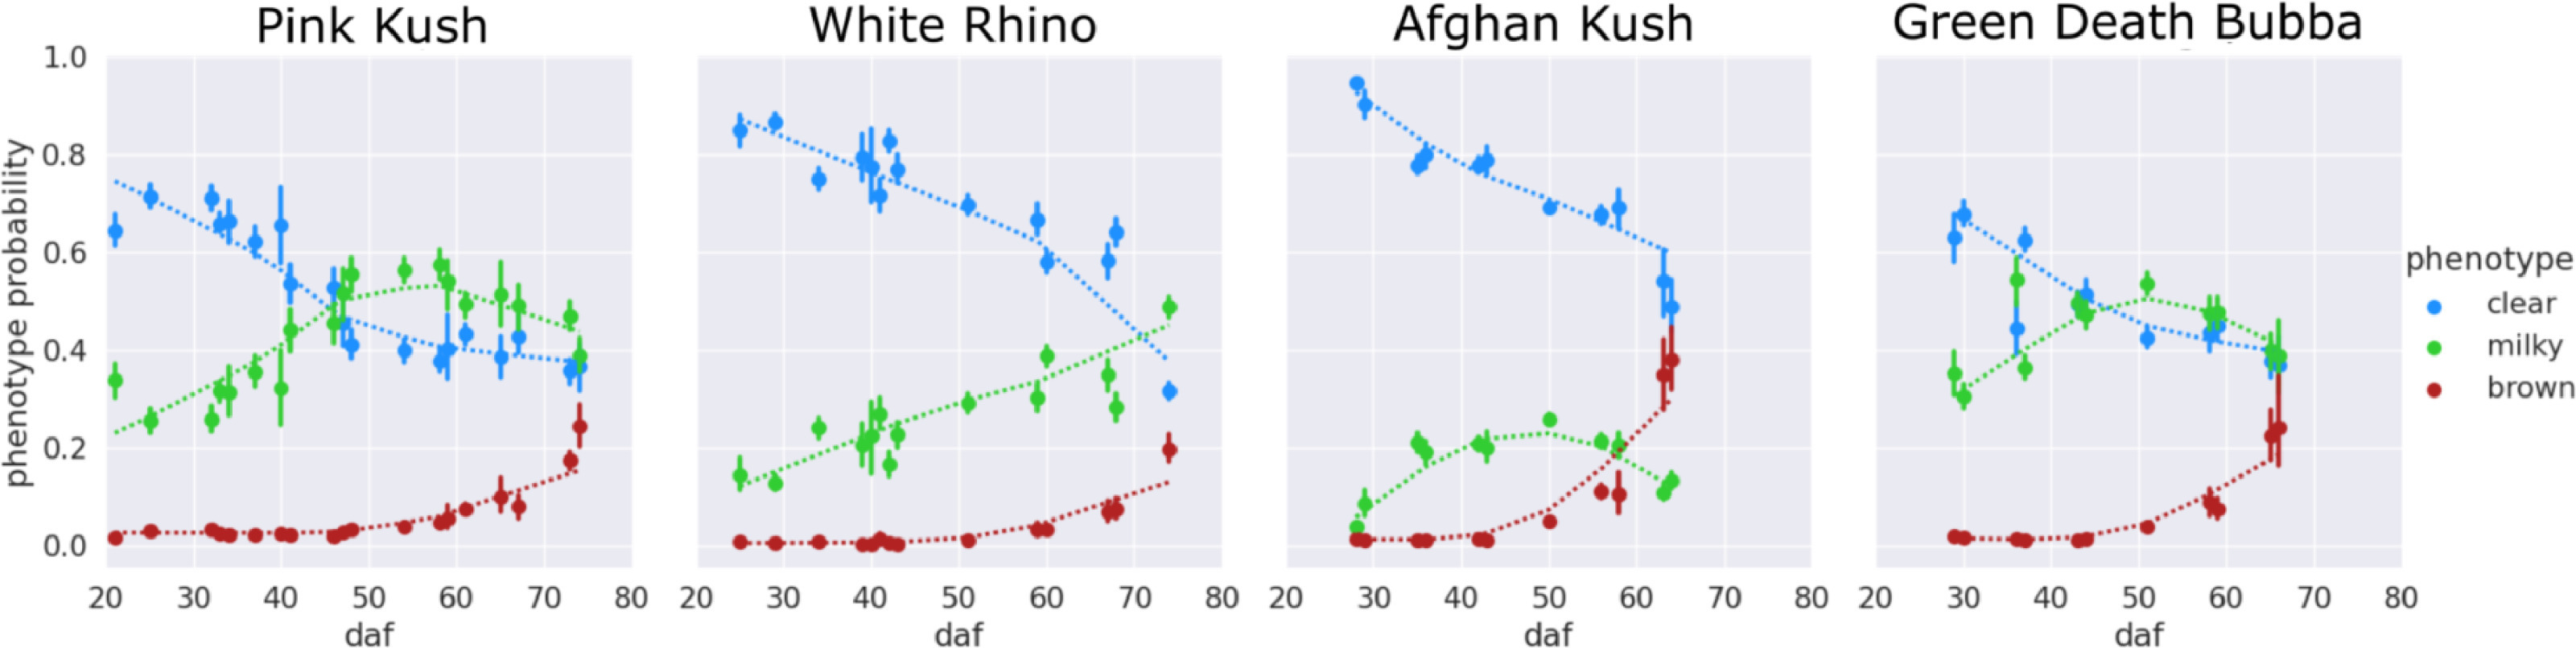
Fig. 7 Color figure of clear, milky, brown phenotype probability. Local regression trend lines (dotted) of clear (blue), milky (green) and brown (red) phenotype probability. Points are means of the observed trichomes, with error bars showing the standard deviation of the mean. Results should be interpreted as the probability of a randomly chosen trichome, observed at a time during the flowering period, belonging to a phenotype class clear, milky, or brown. Local regression lines are for visualizing the phenotype trend over the flowering period. |
|---|---|
| Source |
Sutton, D.B.; Punja, Z.K.; Hamarneh, G. (2023). "Characterization of trichome phenotypes to assess maturation and flower development in Cannabis sativa L. (cannabis) by automatic trichome gland analysis". Smart Agricultural Technology 3: 100111. doi:10.1016/j.atech.2022.100111. |
| Date |
2023 |
| Author |
Sutton, D.B.; Punja, Z.K.; Hamarneh, G. |
| Permission (Reusing this file) |
Creative Commons Attribution-NonCommercial-NoDerivatives 4.0 International |
| Other versions |
Licensing
File history
Click on a date/time to view the file as it appeared at that time.
| Date/Time | Thumbnail | Dimensions | User | Comment | |
|---|---|---|---|---|---|
| current | 17:00, 7 June 2023 | 3,201 × 805 (284 KB) | Shawndouglas (talk | contribs) |
You cannot overwrite this file.
File usage
The following page uses this file:

