


Characterization of trichome phenotypes to assess maturation and flower development in Cannabis sativa L. by automatic trichome gland analysis
Original file (3,243 × 816 pixels, file size: 265 KB, MIME type: image/jpeg)
Summary
| Description |
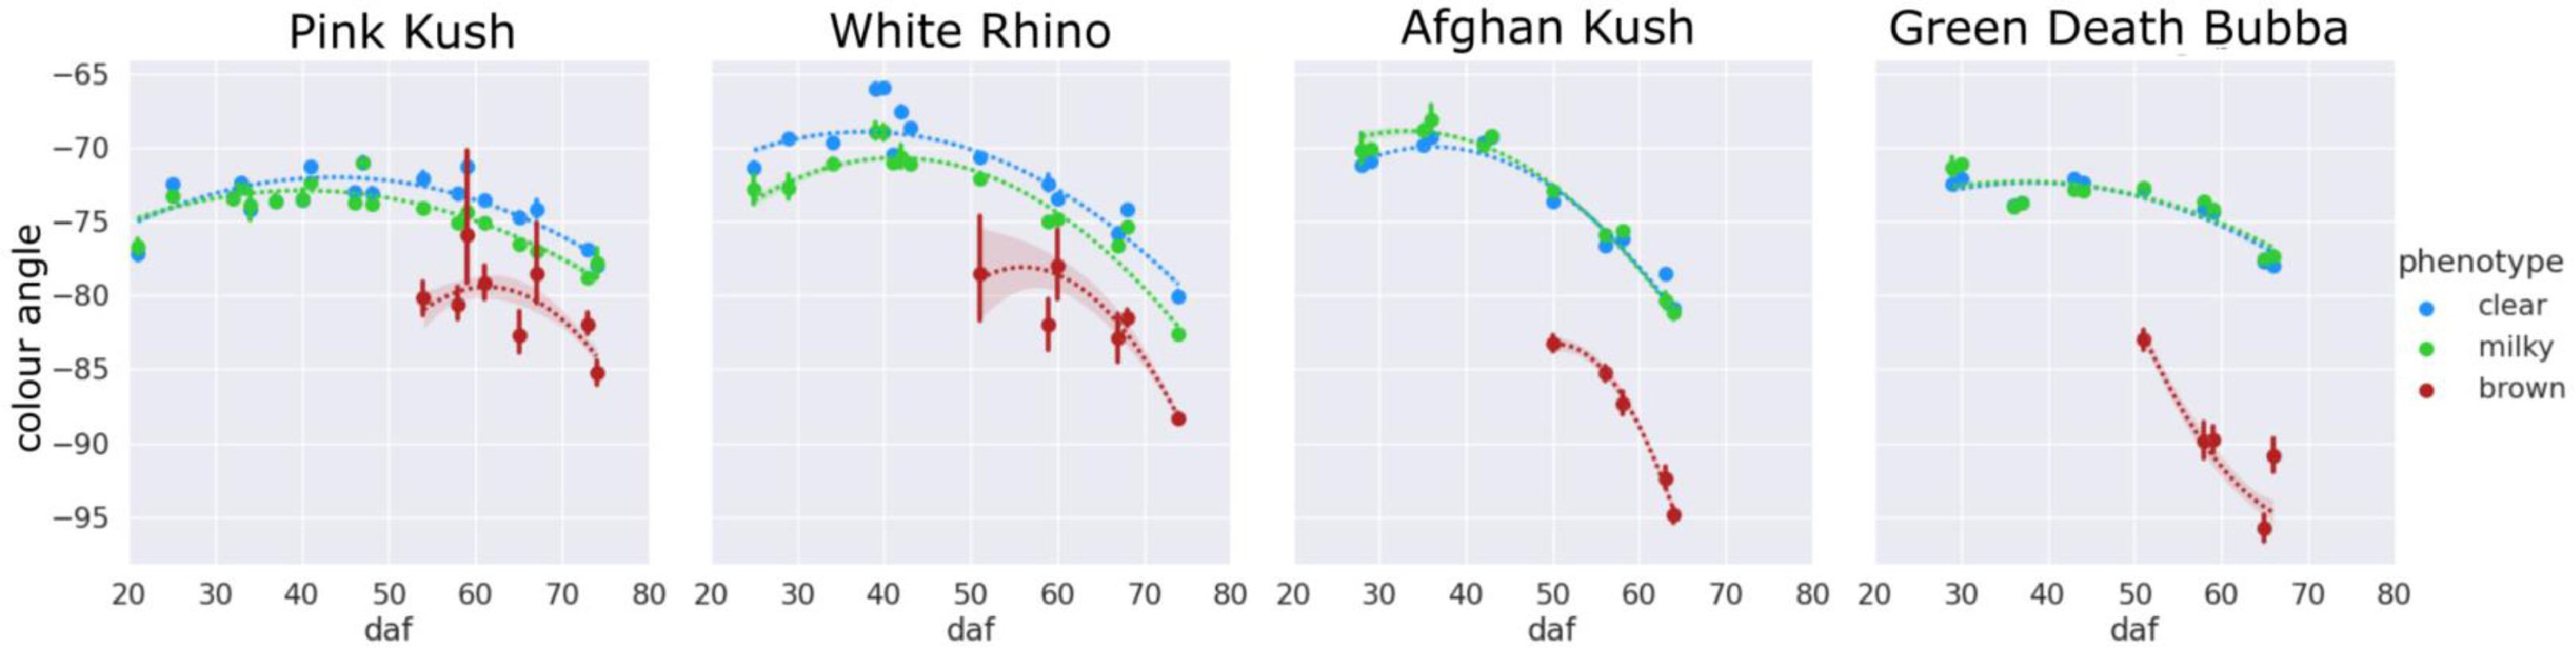
Fig. 15 Color figure of trichome gland head fluorescence. The CIELAB color angle describing fluorescence spectra of for all trichome gland heads observed over the flowering period. Points represent the mean of all trichomes observed at the specified flowering time, with standard error bars representing the standard deviation of the mean. Second order regression lines fitted to each phenotype display 95% confidence intervals as transparent bands. |
|---|---|
| Source |
Sutton, D.B.; Punja, Z.K.; Hamarneh, G. (2023). "Characterization of trichome phenotypes to assess maturation and flower development in Cannabis sativa L. (cannabis) by automatic trichome gland analysis". Smart Agricultural Technology 3: 100111. doi:10.1016/j.atech.2022.100111. |
| Date |
2023 |
| Author |
Sutton, D.B.; Punja, Z.K.; Hamarneh, G. |
| Permission (Reusing this file) |
Creative Commons Attribution-NonCommercial-NoDerivatives 4.0 International |
| Other versions |
Licensing
File history
Click on a date/time to view the file as it appeared at that time.
| Date/Time | Thumbnail | Dimensions | User | Comment | |
|---|---|---|---|---|---|
| current | 17:40, 7 June 2023 | 3,243 × 816 (265 KB) | Shawndouglas (talk | contribs) |
You cannot overwrite this file.
File usage
The following page uses this file:

