Type a search term to find related articles by LIMS subject matter experts gathered from the most trusted and dynamic collaboration tools in the laboratory informatics industry.
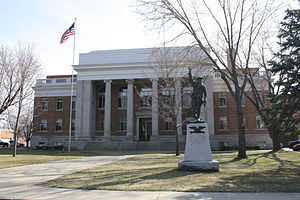
Waushara County | |
|---|---|
 | |
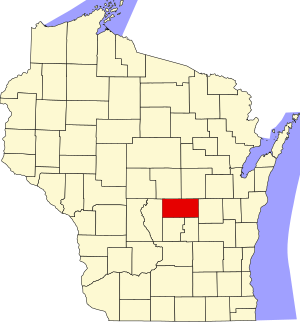
 Location within the U.S. state of Wisconsin | |
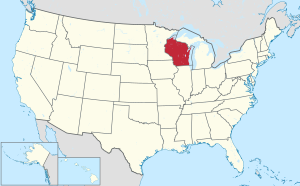
 Wisconsin's location within the U.S. | |
| Coordinates: 44°07′N 89°14′W / 44.11°N 89.24°W | |
| Country | |
| State | |
| Founded | 1852 |
| Named for | Ho-Chunk term meaning "good earth" |
| Seat | Wautoma |
| Largest city | Berlin |
| Area | |
• Total | 637 sq mi (1,650 km2) |
| • Land | 626 sq mi (1,620 km2) |
| • Water | 11 sq mi (30 km2) 1.8% |
| Population | |
• Total | 24,520 |
• Estimate (2023) | 24,934 |
| • Density | 39.2/sq mi (15.1/km2) |
| Time zone | UTC−6 (Central) |
| • Summer (DST) | UTC−5 (CDT) |
| Congressional district | 6th |
| Website | www |
Waushara County is a county located in the U.S. state of Wisconsin. As of the 2020 census, the population was 24,520.[1] Its county seat is Wautoma.[2]
Waushara County is located in central Wisconsin, about 80 miles (130 km) north of Madison.
Waushara County was established by an act of the Wisconsin Legislature on February 15, 1851. It originally consisted of a single organized Town of Waushara. In 1852, the county achieved full organization.[3] The county seat was first located at Sacramento and was relocated to Wautoma in 1854 after a bitter fight between proponents of the two places. The name is of Ho-Chunk origin and is believed to mean "good land".[4][5]
According to the U.S. Census Bureau, the county has a total area of 637 square miles (1,650 km2), of which 626 square miles (1,620 km2) is land and 11 square miles (28 km2) (1.8%) is water.[6]
| ||||||||||||||||||||||||||||||||||||||||||||||||||||||||||||||||||||||||||||||||||||||||||||||||||||||||||||||||||||||||||||
| Census | Pop. | Note | %± |
|---|---|---|---|
| 1860 | 8,770 | — | |
| 1870 | 11,279 | 28.6% | |
| 1880 | 12,687 | 12.5% | |
| 1890 | 13,507 | 6.5% | |
| 1900 | 15,972 | 18.2% | |
| 1910 | 18,886 | 18.2% | |
| 1920 | 16,712 | −11.5% | |
| 1930 | 14,427 | −13.7% | |
| 1940 | 14,268 | −1.1% | |
| 1950 | 13,920 | −2.4% | |
| 1960 | 13,497 | −3.0% | |
| 1970 | 14,795 | 9.6% | |
| 1980 | 18,526 | 25.2% | |
| 1990 | 19,385 | 4.6% | |
| 2000 | 23,154 | 19.4% | |
| 2010 | 24,496 | 5.8% | |
| 2020 | 24,520 | 0.1% | |
| U.S. Decennial Census[8] 1790–1960[9] 1900–1990[10] 1990–2000[11] 2010[12] 2020[1] | |||
As of the census of 2020,[1] the population was 24,520. The population density was 39.2 people per square mile (15.1 people/km2). There were 14,710 housing units at an average density of 23.5 units per square mile (9.1 units/km2). The racial makeup of the county was 89.9% White, 1.6% Black or African American, 0.6% Native American, 0.4% Asian, 0.1% Pacific Islander, 2.8% from other races, and 4.6% from two or more races. Ethnically, the population was 6.9% Hispanic or Latino of any race.
As of the census[13] of 2000, there were 23,154 people, 9,336 households, and 6,581 families residing in the county. The population density was 37 people per square mile (14 people/km2). There were 13,667 housing units at an average density of 22 units per square mile (8.5 units/km2). The racial makeup of the county was 96.80% White, 0.27% Black or African American, 0.31% Native American, 0.35% Asian, 0.03% Pacific Islander, 1.36% from other races, and 0.89% from two or more races. 3.66% of the population were Hispanic or Latino of any race. 47.5% were of German, 9.1% Polish, 5.9% Irish, 5.7% American and 5.6% English ancestry. 94.5% spoke English, 3.4% Spanish and 1.4% German as their first language.
There were 9,336 households, out of which 27.60% had children under the age of 18 living with them, 60.00% were married couples living together, 6.70% had a female householder with no husband present, and 29.50% were non-families. 24.90% of all households were made up of individuals, and 11.90% had someone living alone who was 65 years of age or older. The average household size was 2.43 and the average family size was 2.89.
In the county, the population was spread out, with 23.50% under the age of 18, 6.00% from 18 to 24, 24.90% from 25 to 44, 26.30% from 45 to 64, and 19.20% who were 65 years of age or older. The median age was 42 years. For every 100 females there were 101.60 males. For every 100 females age 18 and over, there were 98.80 males.
In 2017, there were 222 births, giving a general fertility rate of 67.3 births per 1000 women aged 15–44, the 22nd highest rate out of all 72 Wisconsin counties. Of these, 19 of the births occurred at home.[14] Additionally, there were 10 reported induced abortions performed on women of Waushara County residence in 2017.[15]

Waushara County has long been one of the most Republican counties in Wisconsin. Only three Democrats have carried the county at a presidential level since the formation of the Republican Party – Franklin D. Roosevelt in 1932, Bill Clinton in 1996, and Barack Obama in 2008 – of whom only Roosevelt won an absolute majority. In 1936, when Roosevelt carried Wisconsin by a two-to-one majority, Alf Landon won Waushara County by double digits, while it was one of only three Wisconsin counties, alongside Walworth and Waupaca, to vote for Barry Goldwater over Lyndon Johnson in 1964. It has voted Republican since 2012.
In other statewide races, the county is equally Republican. Waushara County has never backed a Democrat for Governor since before 1900.[16] Senators Herb Kohl in 2006 and William Proxmire in 1976 and 1970 did carry Waushara County when they swept every county in the state, but no other Democratic senatorial candidate has won the county since the Seventeenth Amendment.
| Year | Republican | Democratic | Third party(ies) | |||
|---|---|---|---|---|---|---|
| No. | % | No. | % | No. | % | |
| 2024 | 9,625 | 67.01% | 4,571 | 31.82% | 167 | 1.16% |
| 2020 | 9,016 | 66.45% | 4,388 | 32.34% | 164 | 1.21% |
| 2016 | 7,667 | 63.50% | 3,791 | 31.40% | 616 | 5.10% |
| 2012 | 6,562 | 54.47% | 5,335 | 44.28% | 151 | 1.25% |
| 2008 | 5,770 | 48.70% | 5,868 | 49.52% | 211 | 1.78% |
| 2004 | 6,888 | 56.25% | 5,257 | 42.93% | 101 | 0.82% |
| 2000 | 5,571 | 54.36% | 4,239 | 41.36% | 438 | 4.27% |
| 1996 | 3,573 | 40.46% | 3,824 | 43.31% | 1,433 | 16.23% |
| 1992 | 4,045 | 39.16% | 3,402 | 32.94% | 2,882 | 27.90% |
| 1988 | 4,953 | 57.91% | 3,535 | 41.33% | 65 | 0.76% |
| 1984 | 5,769 | 66.79% | 2,782 | 32.21% | 86 | 1.00% |
| 1980 | 5,576 | 61.43% | 2,987 | 32.91% | 514 | 5.66% |
| 1976 | 4,449 | 54.94% | 3,485 | 43.04% | 164 | 2.03% |
| 1972 | 4,466 | 66.27% | 2,094 | 31.07% | 179 | 2.66% |
| 1968 | 4,187 | 65.35% | 1,652 | 25.78% | 568 | 8.87% |
| 1964 | 3,437 | 53.36% | 3,004 | 46.64% | 0 | 0.00% |
| 1960 | 4,906 | 72.16% | 1,888 | 27.77% | 5 | 0.07% |
| 1956 | 4,717 | 76.99% | 1,387 | 22.64% | 23 | 0.38% |
| 1952 | 5,447 | 81.14% | 1,242 | 18.50% | 24 | 0.36% |
| 1948 | 3,594 | 69.60% | 1,430 | 27.69% | 140 | 2.71% |
| 1944 | 4,675 | 75.54% | 1,485 | 23.99% | 29 | 0.47% |
| 1940 | 4,872 | 72.88% | 1,747 | 26.13% | 66 | 0.99% |
| 1936 | 3,302 | 51.43% | 2,636 | 41.05% | 483 | 7.52% |
| 1932 | 2,541 | 44.28% | 3,073 | 53.56% | 124 | 2.16% |
| 1928 | 4,068 | 75.42% | 1,260 | 23.36% | 66 | 1.22% |
| 1924 | 1,602 | 35.43% | 249 | 5.51% | 2,671 | 59.07% |
| 1920 | 4,176 | 85.17% | 482 | 9.83% | 245 | 5.00% |
| 1916 | 2,345 | 67.31% | 1,015 | 29.13% | 124 | 3.56% |
| 1912 | 1,343 | 44.43% | 772 | 25.54% | 908 | 30.04% |
| 1908 | 2,820 | 79.73% | 507 | 14.33% | 210 | 5.94% |
| 1904 | 3,140 | 87.34% | 325 | 9.04% | 130 | 3.62% |
| 1900 | 2,990 | 82.03% | 525 | 14.40% | 130 | 3.57% |
| 1896 | 3,210 | 84.36% | 456 | 11.98% | 139 | 3.65% |
| 1892 | 2,091 | 68.47% | 786 | 25.74% | 177 | 5.80% |