Type a search term to find related articles by LIMS subject matter experts gathered from the most trusted and dynamic collaboration tools in the laboratory informatics industry.
Outagamie County | |
|---|---|
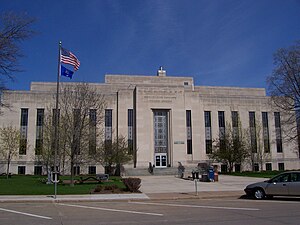
 Outagamie County Administration Complex | |
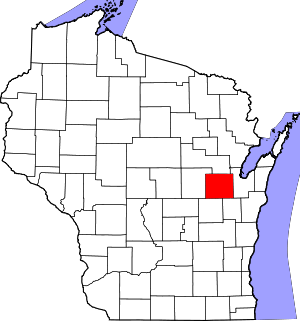
 Location within the U.S. state of Wisconsin | |
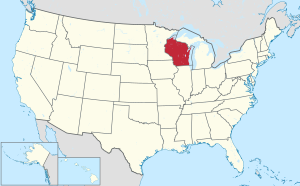
 Wisconsin's location within the U.S. | |
| Coordinates: 44°25′N 88°28′W / 44.41°N 88.46°W | |
| Country | |
| State | |
| Founded | 1852 |
| Seat | Appleton |
| Largest city | Appleton |
| Area | |
• Total | 645 sq mi (1,670 km2) |
| • Land | 638 sq mi (1,650 km2) |
| • Water | 7.1 sq mi (18 km2) 1.1% |
| Population (2020) | |
• Total | 190,705 |
• Estimate (2023) | 193,234 |
| • Density | 300/sq mi (110/km2) |
| Time zone | UTC−6 (Central) |
| • Summer (DST) | UTC−5 (CDT) |
| Congressional district | 8th |
| Website | www |
Outagamie County (/ˌaʊtəˈɡeɪmi/ OW-tə-GAY-mee)[1] is a county in the Fox Cities region of the U.S. state of Wisconsin, located in the northeast of the state. As of the 2020 Census, the population was 190,705.[2] Its county seat is Appleton.[3]
Outagamie County is included in the Appleton, WI Metropolitan Statistical Area, which is also included in the Appleton-Neenah-Oshkosh, WI Combined Statistical Area. It was named for the historic Meskwaki (Fox) people.
"Outagamie," a French transliteration of the Anishinaabe term for the Meskwaki (Fox) people, meant "dwellers of other shore" or "dwellers on the other side of the stream," referring to their historic habitation along the St. Lawrence River and south of the Great Lakes. They had occupied considerable territory in Wisconsin prior to colonization.[4] Outagamie County was created in 1851 and organized in 1852.[5] Prior to this it was under the jurisdiction of Brown County.
According to the U.S. Census Bureau, the county has a total area of 645 square miles (1,670 km2), of which 638 square miles (1,650 km2) is land and 7.1 square miles (18 km2) (1.1%) is water.[6]
Outagamie County's government consists of an elected County Board of Supervisors, a County Executive, and 36 county agencies and departments.[7][8]
The county executive serves as its chief executive officer, participating in the legislative process with the County Board of Supervisors and exercising administrative authority and control over the county's operations, departments, offices, boards, programs, and communications.[9]
Department heads are appointed by the county executive, subject to the approval of the board of supervisors. The county executive also appoints members to the county's boards and commissions. The county executive sets the annual budget in consultation with and subject to the approval of the board of supervisors.[10][11]
County Executive Tom Nelson was first elected in 2011.[12]
| Census | Pop. | Note | %± |
|---|---|---|---|
| 1860 | 9,587 | — | |
| 1870 | 18,430 | 92.2% | |
| 1880 | 28,716 | 55.8% | |
| 1890 | 38,690 | 34.7% | |
| 1900 | 46,247 | 19.5% | |
| 1910 | 49,102 | 6.2% | |
| 1920 | 55,113 | 12.2% | |
| 1930 | 62,790 | 13.9% | |
| 1940 | 70,032 | 11.5% | |
| 1950 | 81,722 | 16.7% | |
| 1960 | 101,794 | 24.6% | |
| 1970 | 119,356 | 17.3% | |
| 1980 | 128,799 | 7.9% | |
| 1990 | 140,510 | 9.1% | |
| 2000 | 160,971 | 14.6% | |
| 2010 | 176,695 | 9.8% | |
| 2020 | 190,705 | 7.9% | |
| U.S. Decennial Census[14] 1790–1960[15] 1900–1990[16] 1990–2000[17] 2010[18] 2020[2] | |||
As of the census of 2020,[2] the population was 190,705. The population density was 299.1 people per square mile (115.5 people/km2). There were 79,131 housing units at an average density of 124.1 units per square mile (47.9 units/km2). The racial makeup of the county was 86.0% White, 3.5% Asian, 1.6% Native American, 1.6% Black or African American, 0.1% Pacific Islander, 2.0% from other races, and 5.3% from two or more races. Ethnically, the population was 4.9% Hispanic or Latino of any race.
As of the census[19] of 2000, there were 160,971 people, 60,530 households, and 42,189 families residing in the county. The population density was 251 people per square mile (97 people/km2). There were 62,614 housing units at an average density of 98 units per square mile (38 units/km2). The racial makeup of the county was 93.87% White, 0.54% Black or African American, 1.54% Native American, 2.23% Asian, 0.03% Pacific Islander, 0.81% from other races, and 0.98% from two or more races. 1.99% of the population were Hispanic or Latino of any race. 47.7% were of German, 9.4% Dutch, 6.2% Irish and 5.2% American and French-Canadian ancestry.
Of the 60,530 households, 36.00% had children under the age of 18 living with them, 58.90% were married couples living together, 7.60% had a female householder with no husband present, and 30.30% were non-families. 24.20% of all households were made up of individuals, and 8.40% had someone living alone who was 65 years of age or older. The average household size was 2.61 and the average family size was 3.14.
By age, 27.70% of the population was under 18, 8.90% from 18 to 24, 31.90% from 25 to 44, 20.70% from 45 to 64, and 10.90% were 65 or older. The median age was 34 years. For every 100 females there were 99.50 males. For every 100 females age 18 and over, there were 96.90 males.
In 2017, there were 2,204 births, giving a general fertility rate of 64.0 births per 1000 women aged 15–44, the 34th highest rate out of all 72 Wisconsin counties.[20] Additionally, there were 136 reported induced abortions performed on women of Outagamie County residence in 2017.[21]


Outagamie County has voted for the Republican presidential candidate in 19 of the last 22 presidential elections.
| Year | Republican | Democratic | Third party(ies) | |||
|---|---|---|---|---|---|---|
| No. | % | No. | % | No. | % | |
| 2024 | 60,827 | 54.34% | 49,438 | 44.17% | 1,667 | 1.49% |
| 2020 | 58,385 | 54.05% | 47,667 | 44.13% | 1,970 | 1.82% |
| 2016 | 49,879 | 53.10% | 38,068 | 40.53% | 5,986 | 6.37% |
| 2012 | 47,372 | 50.08% | 45,659 | 48.27% | 1,565 | 1.65% |
| 2008 | 39,677 | 43.33% | 50,294 | 54.93% | 1,592 | 1.74% |
| 2004 | 48,903 | 54.31% | 40,169 | 44.61% | 978 | 1.09% |
| 2000 | 39,460 | 52.10% | 32,735 | 43.22% | 3,547 | 4.68% |
| 1996 | 27,758 | 42.78% | 28,815 | 44.41% | 8,316 | 12.82% |
| 1992 | 30,370 | 41.65% | 23,735 | 32.55% | 18,806 | 25.79% |
| 1988 | 33,113 | 54.04% | 27,771 | 45.32% | 394 | 0.64% |
| 1984 | 36,773 | 64.54% | 19,790 | 34.73% | 416 | 0.73% |
| 1980 | 31,500 | 52.99% | 21,284 | 35.81% | 6,657 | 11.20% |
| 1976 | 28,363 | 54.02% | 23,079 | 43.95% | 1,065 | 2.03% |
| 1972 | 27,533 | 59.84% | 17,447 | 37.92% | 1,028 | 2.23% |
| 1968 | 25,080 | 59.29% | 14,224 | 33.63% | 2,997 | 7.08% |
| 1964 | 18,595 | 46.26% | 21,556 | 53.62% | 47 | 0.12% |
| 1960 | 24,146 | 58.15% | 17,287 | 41.63% | 89 | 0.21% |
| 1956 | 26,090 | 76.56% | 7,725 | 22.67% | 262 | 0.77% |
| 1952 | 26,603 | 73.86% | 9,373 | 26.02% | 44 | 0.12% |
| 1948 | 16,161 | 58.40% | 11,233 | 40.59% | 278 | 1.00% |
| 1944 | 18,294 | 64.44% | 9,955 | 35.07% | 140 | 0.49% |
| 1940 | 17,733 | 58.98% | 12,168 | 40.47% | 166 | 0.55% |
| 1936 | 9,485 | 34.66% | 16,163 | 59.07% | 1,716 | 6.27% |
| 1932 | 8,517 | 33.91% | 16,186 | 64.44% | 415 | 1.65% |
| 1928 | 12,378 | 49.58% | 12,474 | 49.97% | 112 | 0.45% |
| 1924 | 6,426 | 35.39% | 1,255 | 6.91% | 10,479 | 57.70% |
| 1920 | 11,140 | 74.69% | 3,121 | 20.93% | 654 | 4.38% |
| 1916 | 5,302 | 52.97% | 4,442 | 44.38% | 265 | 2.65% |
| 1912 | 2,384 | 28.82% | 4,139 | 50.04% | 1,748 | 21.13% |
| 1908 | 5,079 | 52.34% | 4,286 | 44.17% | 339 | 3.49% |
| 1904 | 5,949 | 63.65% | 3,143 | 33.63% | 254 | 2.72% |
| 1900 | 5,245 | 55.15% | 4,008 | 42.14% | 258 | 2.71% |
| 1896 | 5,433 | 55.42% | 4,096 | 41.78% | 275 | 2.80% |
| 1892 | 2,733 | 35.91% | 4,545 | 59.72% | 333 | 4.38% |