Histopathology image classification: Highlighting the gap between manual analysis and AI automation
Contents
Green Bay Area | |
|---|---|
 Lambeau Field in 2023 | |
 | |
| Country | |
| State | |
| Largest city | Green Bay |
| Area | |
| • Land | 1,880 sq mi (4,870 km2) |
| Population | |
• Total | 328,268 |
| GDP | |
| • Total | $24.565 billion (2022) |
| Time zone | UTC−06:00 (CST) |
| • Summer (DST) | UTC−05:00 (CDT) |
The Green Bay metropolitan statistical area, as defined by the United States Census Bureau, is a metropolitan area in northeastern Wisconsin anchored by the City of Green Bay. It is Wisconsin's fourth largest metropolitan statistical area by population. As of the 2020 Census, the MSA had a combined population of 328,268.
Counties
Cities
Principal
Metro area cities and villages with more than 10,000 inhabitants
Metro area cities and villages with fewer than 10,000 inhabitants
- Algoma
- Casco
- Denmark
- Gillett
- Kewaunee
- Lena
- Luxemburg
- Oconto
- Oconto Falls
- Pulaski (partial)
- Suring
- Wrightstown
Unincorporated communities
Towns
Brown County
Kewaunee County
Oconto County
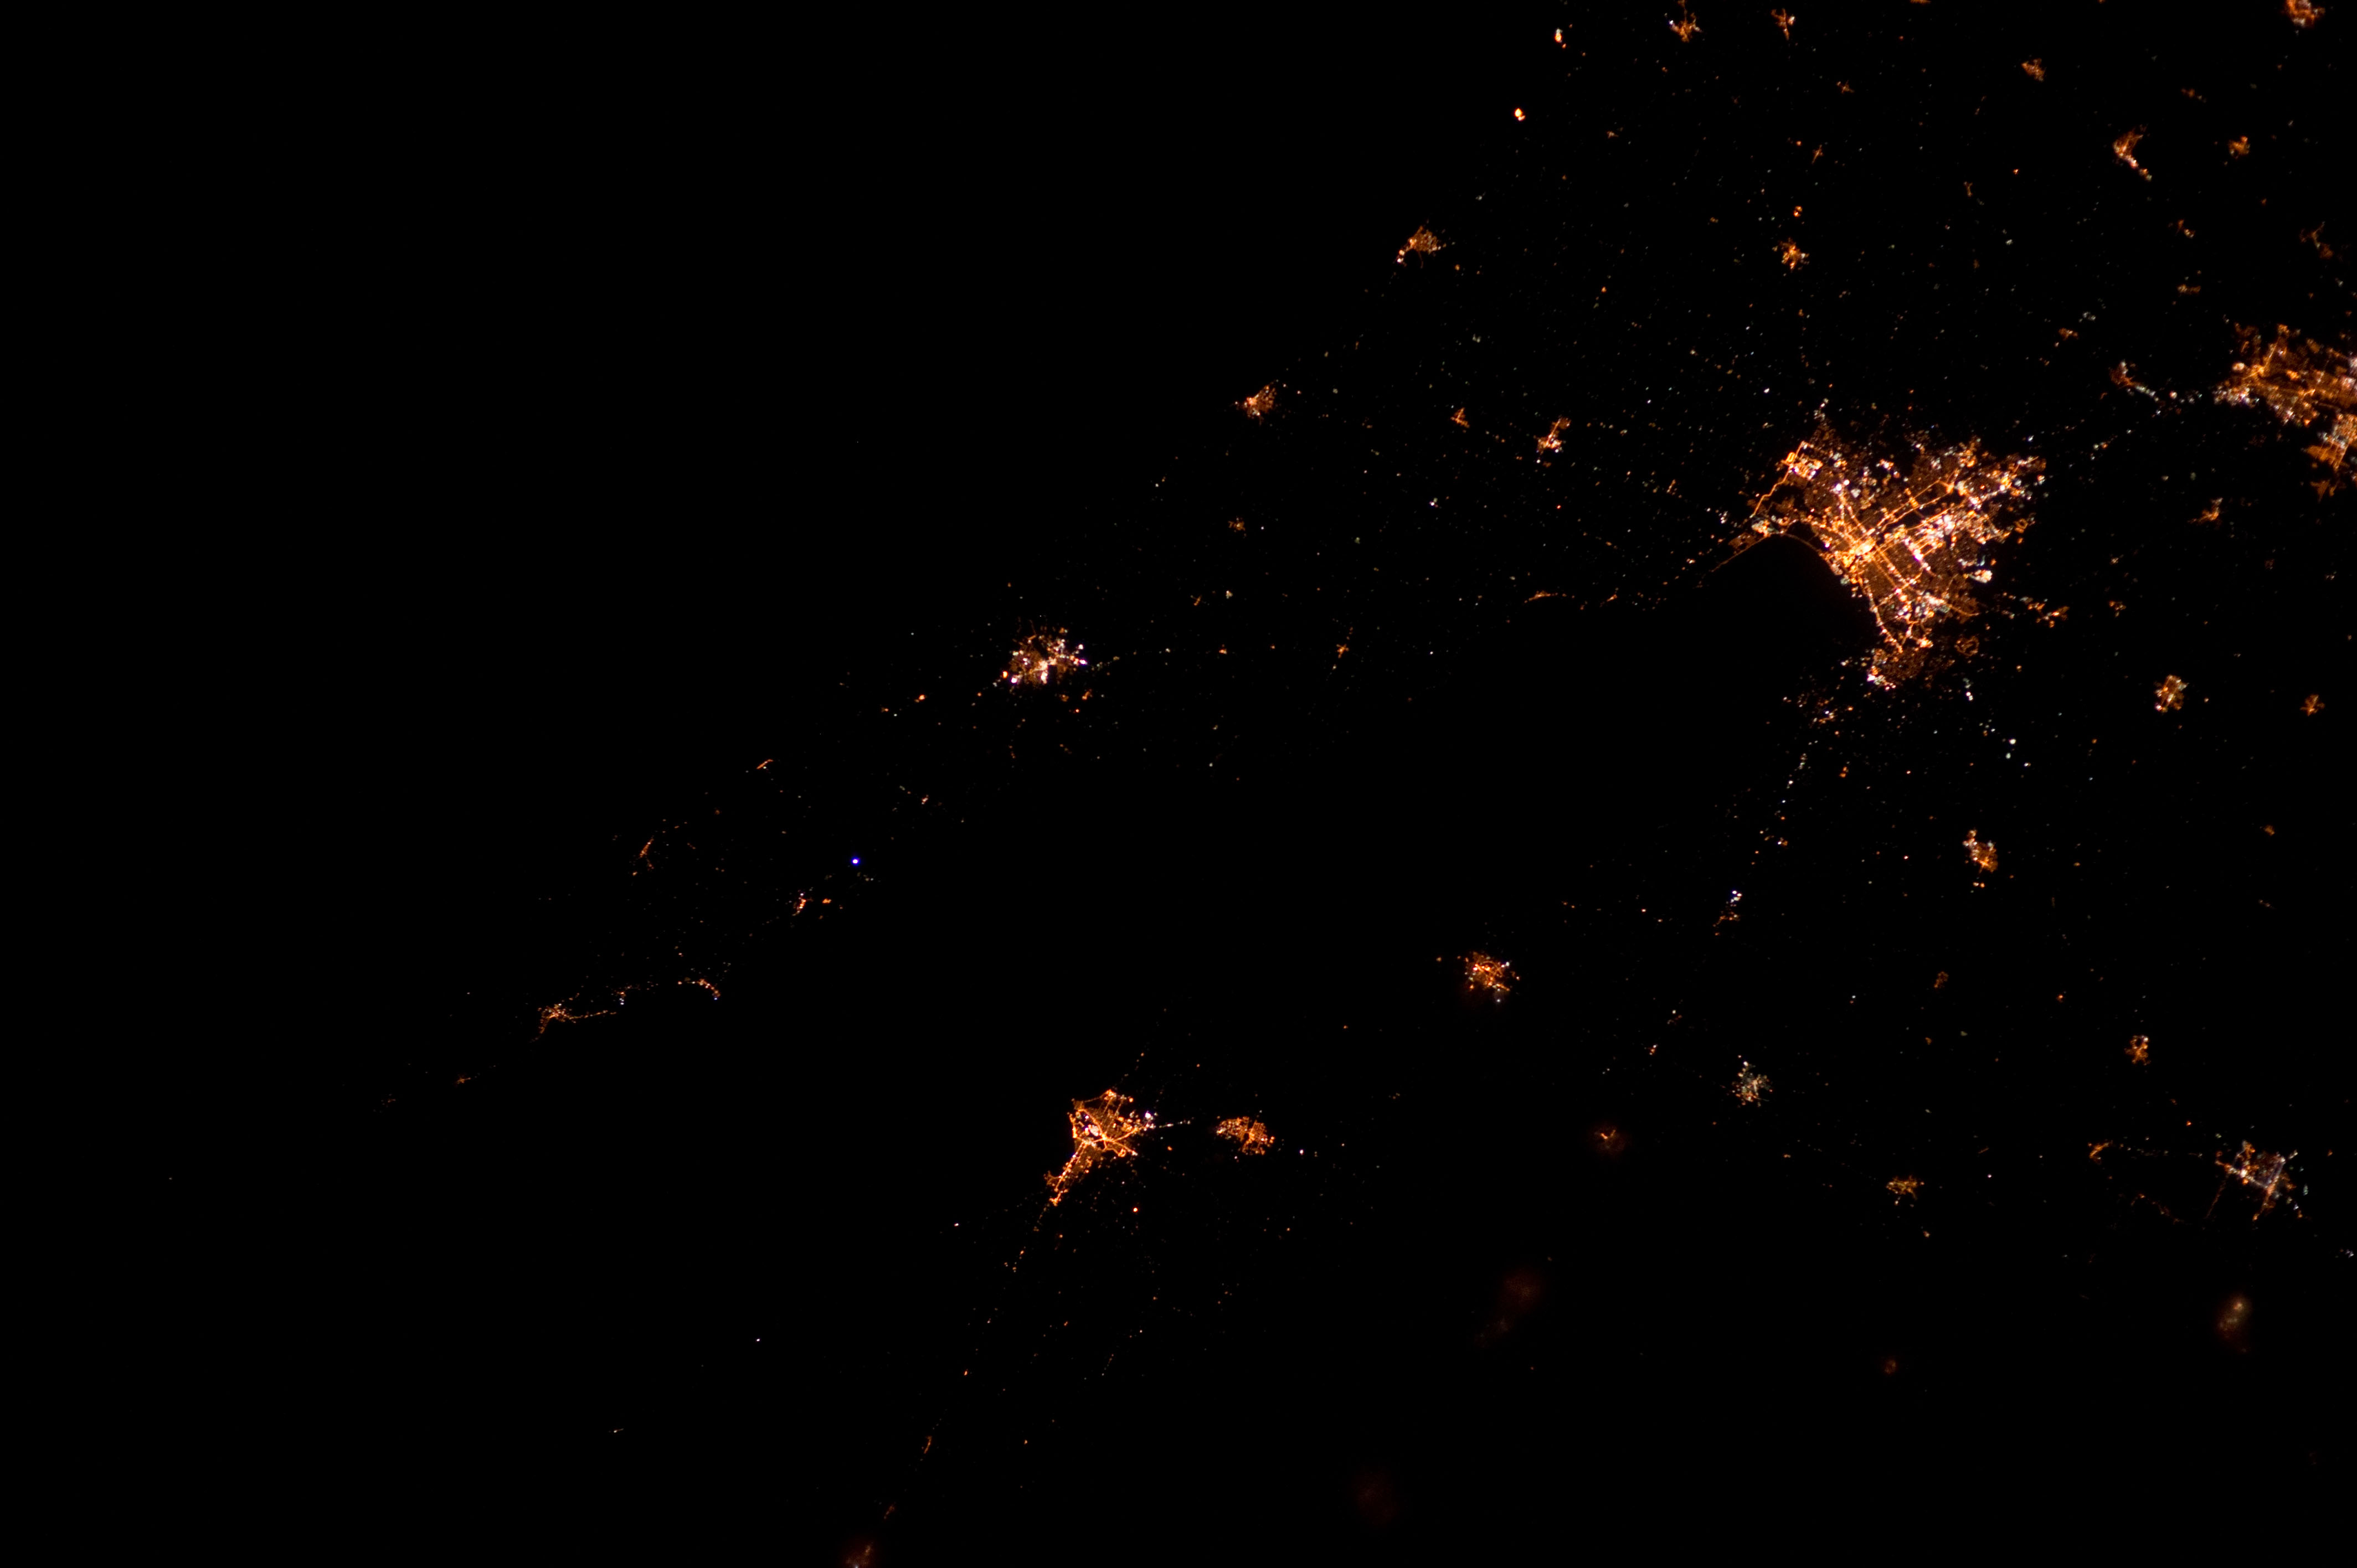
View at night
Demographics
| Census | Pop. | Note | %± |
|---|---|---|---|
| 1900 | 46,359 | — | |
| 1910 | 54,098 | 16.7% | |
| 1920 | 61,889 | 14.4% | |
| 1930 | 70,249 | 13.5% | |
| 1940 | 83,109 | 18.3% | |
| 1950 | 98,314 | 18.3% | |
| 1960 | 168,474 | 71.4% | |
| 1970 | 202,758 | 20.3% | |
| 1980 | 223,766 | 10.4% | |
| 1990 | 243,698 | 8.9% | |
| 2000 | 282,599 | 16.0% | |
| 2010 | 306,241 | 8.4% | |
| 2020 | 328,268 | 7.2% | |
| 2021 (est.) | 329,490 | 0.4% | |
| U.S. Decennial Census[2] | |||
As of the census[3] of 2000, there were 282,599 people, 108,897 households, and 73,126 families residing within the MSA. The racial makeup of the MSA was 92.51% White, 0.96% African American, 1.95% Native American, 1.78% Asian, 0.02% Pacific Islander, 1.57% from other races, and 1.20% from two or more races. Hispanic or Latino of any race were 3.22% of the population.
The median income for a household in the MSA was $43,824, and the median income for a family was $51,085. Males had a median income of $34,552 versus $23,499 for females. The per capita income for the MSA was $19,752.
See also
References
- ^ "Total Gross Domestic Product for Green Bay, WI (MSA)". Federal Reserve Economic Data. Federal Reserve Bank of St. Louis.
- ^ "U.S. Decennial Census". United States Census Bureau. Archived from the original on May 7, 2015. Retrieved April 12, 2020.
- ^ "U.S. Census website". United States Census Bureau. Retrieved 2008-01-31.


